
Closing the Quarter – Q1’24
In today’s thought leadership, we cover:
- Key Events this week
- Closing the Quarter Summary — Q1’24 performance and outlook, notable inflections, guidance moves and consensus shifts, and capital allocation
Key Events
Inflation
- U.S. inflation eased slightly in April. The Consumer-Price Index, a gauge for goods and service costs across the U.S. economy, rose 3.4% in April from a year ago, in line with expectations, offering relief to investors and the Federal Reserve after a run of economic data at the start of the year revealed simmering price pressures. (Source: Labor Department)
- U.S. import prices surged 0.9% last month, the largest increase since March 2022 after an upwardly revised 0.6% rise in March, suggesting that domestic inflation could remain elevated for a while. In the 12 months through April, import prices accelerated 1.1%, the largest gain since December 2022. (Source: Labor Department)
Production
- Production at factories fell 0.5% YoY in April amid declines in motor vehicle output. Manufacturing output, which accounts for 10.4% of the economy, dropped 0.3% last month following a downwardly revised 0.2% increase in March and remains constrained by higher borrowing costs. (Source: Fed)
Retail Sales
- U.S. retail sales were unexpectedly flat in April as higher gas prices pulled spending away from other goods, indicating that consumer spending was losing momentum. The unchanged reading in retail sales last month followed a slightly downwardly revised 0.6% increase in March. Economists had forecast retail sales to gain 0.4% in April. (Source: Commerce Department)
Labor
- Initial jobless claims, a proxy for layoffs, dropped 10,000 to a seasonally adjusted 222,000 for the week ended May 11. The decline reversed a portion of the jump in the prior week, which had pushed claims to the highest level in more than eight months. (Source: Labor Department)
Tariffs
- The Biden administration is preparing to raise tariffs on clean-energy goods from China in the coming days, with the levy on Chinese electric vehicles set to roughly 100%. Beyond raising tariffs on EVs, the White House said President Biden was increasing a key tariff rate on steel and aluminum products to 25% from 7.5%, while the tariff on solar cells would rise to 50% from 25%, and a new duty on shipping cranes would be 25%. Those tariff increases, among others, will kick in this year, while others, including a tariff increase to 25% from 7.5% for larger storage batteries and a new tariff on natural graphite set at 25%, will take effect in 2026. (Source: WSJ)
Closing the Quarter Summary
Heading into earnings season, our Q1’24 Inside The Buy-Side® Earnings Primer® survey, published April 11, registered higher optimism despite dashed rate cut hopes and stickier inflation. Supporting this uptrend was the view the U.S. would dodge a recession and deliver strong YoY Q1 prints. Still, investor exuberance remained in check amid continued macro and monetary policy uncertainty, with margins back in focus in a bigger way QoQ.
With Q1’24 earnings season in the books, we “Close the Quarter” with some notable themes:
1. Earnings and Outlook
Prints Surpassed Already Strong Expectations, Particularly on the Bottom-line; Executives Pointed to Favorable Outlooks and Hung their Hats on the Back Half of 2024
Overall, Q1 prints fared better than expected, particularly on the bottom line.
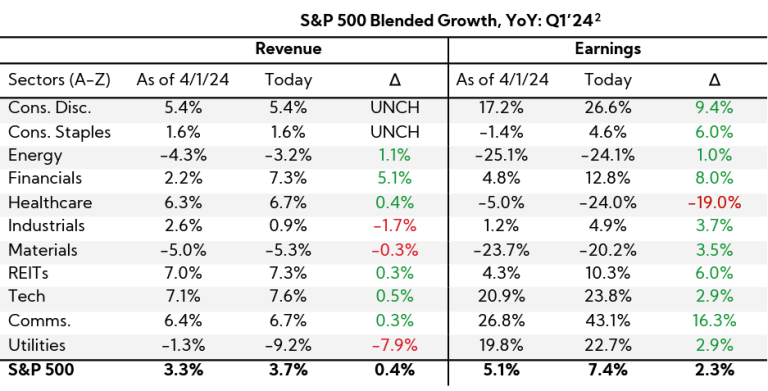
With over 90% of S&P 500 companies reporting earnings to date, the index is reporting YoY blended1 revenue and earnings growth of 3.7% and 7.4%, respectively. While top-lines have surpassed consensus estimates by 1.0% on average, which is below the one-year average of 1.4%, bottom-line beats have averaged 8.3% above consensus estimates, well above the one-year average of 6.4%.
Indeed, as of April 1st, growth expectations for Q1 were more than 200 bps lower (5.1%) than where the blended results are today (7.4%). All sectors except Healthcare, which was weighed down heavily by Myers Squibb due to acquisition and R&D charges, registered increasing above-consensus performance throughout the quarter compared with initial expectations at the beginning of April, particularly the Communications, Consumer Discretionary, and Financials sectors.
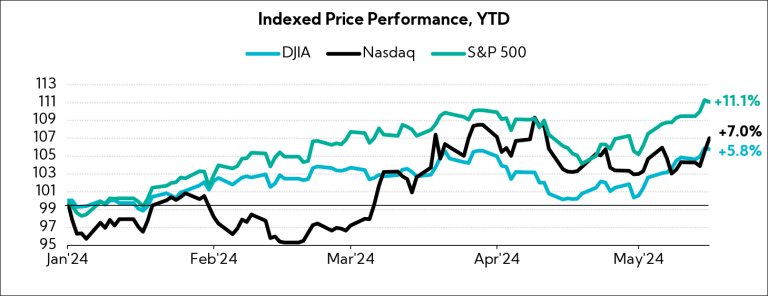
What’s more, many executives throughout earnings calls transmitted optimism about outlooks for the remainder of the year which, along with hot earnings prints and cooler inflation data, helped push the S&P 500, Nasdaq composite, and DJIA to record highs this week. As a result, the indices are up 11.1%, 7.0%, and 5.8% YTD, respectively.
- Frontier Communications (Communication Services, $6.5B): “Underlying demand is still very healthy, but there might be some of those orders that get pushed into late Q2 or into future quarters…overall, we feel good about our net add momentum. We expect a strong quarter in Q2, followed by a strong second half of the year.”
- Hershey (Consumer Staples, $41.9B): “As we look at the second half of the year, we do feel trends are positive. But, obviously, we had some very strong seasonal performance in 2023. So, we think the second half will grow, but the growth will moderate and perhaps be more in line with our overall growth as a company versus kind of super-sized in the back half.”
- Energizer Holdings (Consumer Staples, $2.2B): “The underlying category trends are healthy. We’re seeing stability and improving trends in home center and in non-tracked channels. We’re really well positioned in terms of going forward and we’re confident in the back half of the year, as well as heading into 2025.”
- Middleby (Industrials, $7.2B): “We should continue to build and strengthen as we progress through 2024. We look forward to Q2 being stronger than Q1 and we continue to firmly believe at this time that for the second half of this year we will deliver sequential and year-over-year growth. We remain focused on operational efficiency and optimally managing our resources. We are sharply focused on controlling and reducing our costs.”
- Kulicke & Soffa Industries (Technology, $2.6B): “We are definitely seeing over the last couple of months gradually improving order requests as well as customer inquiries. The deals are starting to come. We do see the utilization rates also creeping up. And even in the weaker end markets, we are starting to get some discussion with customers about their future demand. We believe the second half will be better than the first half, but definitely early FY 2025, that’s when the ramp probably should kick off.”
- Element Solutions (Materials, $5.8B): “Our customer base is broad, and our growth generation correlates to overall industry units rather than any particular manufacturer over time. Customers globally are expecting an improved second half.”
- Realty Income (REITs, $48.2B): “Many potential sellers of real estate remain sidelined given this uncertain interest rate environment which is amplified by mixed inflation-related data over the last six months. Sellers remain reluctant to transact, and the breadth and depth of domestic investment opportunities have compressed as a result. However, as experienced in prior cycles, we remain optimistic that the market will provide more opportunities in the second half of the year as the economic outlook becomes clearer.”
With the “back half narrative” fully in play, looking at the last two years, analysts are forecasting the highest levels of revenue and earnings growth for the index since Q1’22 which benefitted from what we call the “capex super cycle” that began Q2’21, with momentum building as we move through 2024.
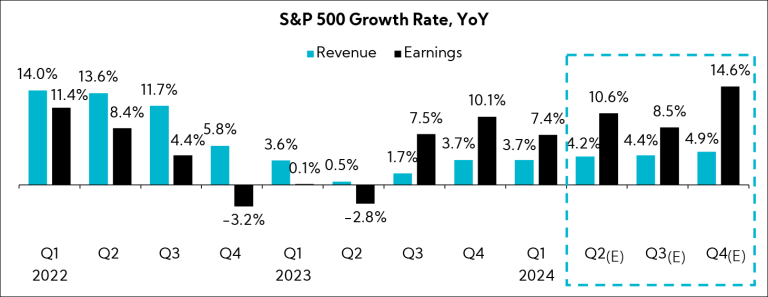
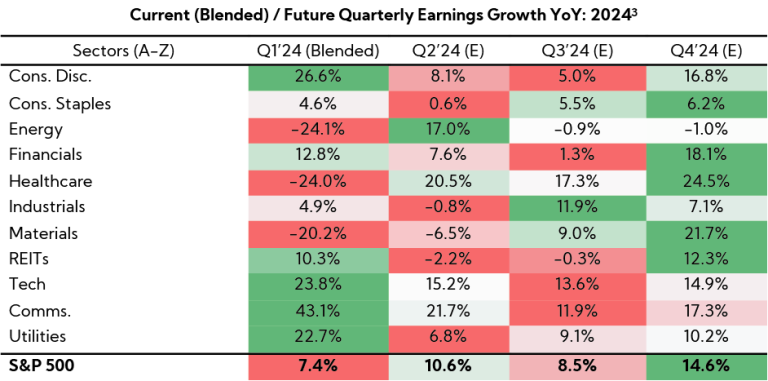
In fact, nearly all sectors, with the notable exception of Energy, are anticipated to experience growth in Q4, with analysts expecting it to be the best quarter of 2024 for 5 out of 11 sectors.
Below is Q1’s blended YoY earnings growth by sector, along with estimates for the remainder of the year color coded based on relative estimated performance (dark red = worst quarter for a given sector, dark green = best).
2. Notable Inflections
The Consumer Pulls Back, Inventory Destocking Nears an End, and Executives Double Down on Expense Management and Productivity Initiatives
A) The Consumer
A key theme this quarter, our coverage of Consumer Discretionary earnings suggested consumers pulled back harder on spending, at least across many restaurant and retail providers. Throughout the first three months of the year, many noted a cautious consumer environment, resulting in subdued traffic, sales, and an overall more competitive landscape. Executives are observing “continued softness in consumer discretionary spend,” with lower-income shoppers becoming increasingly discerning with their purse-strings. Notably, certain executives commented that they are seeing more pronounced weakness in North America and consumers pivoting payment from debit card to credit card for the first time.
As we covered above in the Key Events section, the data supports this trend. Retail sales were unchanged last month, coming in well below economists’ expectations. And, while many have pointed to back half strength in their prepared remarks, 35% of investors expect Consumer Confidence to Worsen over the next six months according to our Q1’24 Inside The Buy-Side® Earnings Primer® published last month, an increase from the 23% registered in last quarter’s survey.
- Walmart (Consumer Staples, $515.3B): “Many consumer pocketbooks are still stretched, and we see the effect of that in our business mix as they’re spending more of their paychecks on nondiscretionary categories and less on general merchandise.”
- UTZ Brands (Consumer Staples, $1.5B): “What you’re hearing across the industry is that consumers are value-seeking, and there’s a subsegment of the low-income consumer who is now more specifically price shopping than what they had been historically.”
- Capital One Financial (Financials, $54.3B): “Rising incomes have kept consumer debt servicing burdens relatively low by historical standards. And when we look at our customers, we see that they have higher bank balances than before the pandemic, and this is true across income levels. On the other hand, inflation shrank real incomes for almost two years. And in this high interest rate environment, the cost of new borrowing has gone up in every major asset class. And I think at the margin, these effects have stretched some consumers financially.”
B) Inventory Normalization
Since the recovery of supply chains, there has been a concerted effort by companies to reduce large and costly inventory buffers, efforts of which took longer than anticipated given shrinking demand. This trend came to a head this quarter, with many company executives across sectors noting inventory levels have largely decreased, in some cases to quantities below pre-COVID levels.
Indeed, U.S. wholesale inventories fell by 0.4% in March on a monthly basis and 2.3% on a YoY basis. As companies have seemingly crossed the inventory glut Rubicon or will shortly, talk of “green shoots” related to orders and volume in certain hard-hit sectors, such as Chemicals, emerged. While demand remains challenging for many, it seems we will soon be able to turn the corner on the historic “inventory destocking” period.
- Kontoor Brands (Consumer Discretionary, $3.8B): “Inventory levels in the market are much improved versus a year ago. I’d say we’re pretty much back at more normalized levels of inventory and we continue to work on improving the health and quality of our retail partners.”
- Spectrum Brand Holdings (Consumer Staples, $2.7B): “What the headline should be, if you want to write an earnings recap, is we’ve really got our operational house in order. We’ve got better freight lines and better freight rates. The teams have worked judiciously to put together a real S&OP process. Not only are we getting raw material correctly, we’re making raw material more, and we’re turning that into finished goods more efficiently. We’ve gotten rid of excess storage capacities and all the expenses that come with another $300M – $400M of inventory. Inventory turns are rising.”
- FMC Corp (Materials, $8.0B): “Data from third parties as well as input from our commercial teams shows that the inventory reduction actions in the channel are making good progress. On a regional basis, the pace of destocking is varied. We see North America furthest along with inventories at the retail and grower levels back to normal, while distributors are still working to reduce their level of inventory. EMEA is in a similar condition, except in countries hit by unfavorable weather. In both geographies, our customers are now targeting to operate with inventories at lower-than-normal levels.”
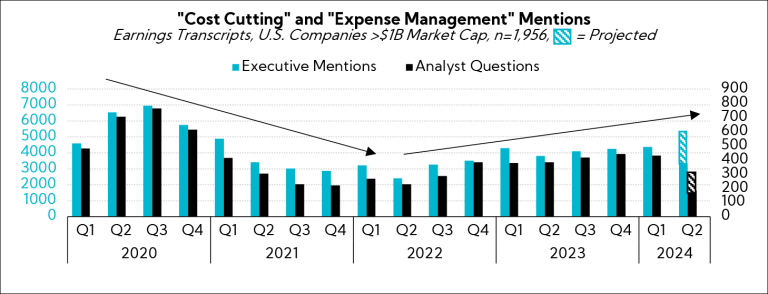
C) Expense Management and Productivity Initiatives
With a high bar set for earnings expectations for the remainder of the year, and continued underlying economic uncertainty, there was an acute focus from both executives and The Street on preserving profitability. In fact, “cost cutting” and “expense management” mentions across executive prepared remarks and analyst questions have been on an uptrend during earnings calls through 2023 and into 2024. Executives across sectors devoted considerable effort to communicating bottom-line management, including headcount and variable pay reductions for sectors like Materials, while touting productivity initiatives such as AI and supply chain shifts in the face of high labor cost headwinds.
Heading into the quarter, we identified more investors and analysts prioritizing margins over growth at this point in the cycle, and “margins and expense management” was identified as the leading topic for executives to address on calls.
- US Foods (Consumer Staples, 13.7B): “We have the right strategies in place and are expanding gross margins through initiatives such as cost of goods management and driving Opex productivity through improved routing, administrative process streamlining and indirect spend management.”
- National Vision Holdings (Consumer Discretionary, 1.2B): “We continue to be very disciplined with expense management and have implemented efficiencies to streamline processes and reduce cost. For example, during the quarter, we modified our store staffing program to better align store performance and demand, without sacrificing customer service.”
- Alpha Metallurgical Resources (Materials, $3.8B): “We’ve made small adjustments to safely reduce costs where possible by optimizing production and logistics. We have made the difficult decision to make certain incentives cuts across the organization.”
- Builders FirstSource (Industrials, $20.6B): “We drove $40M in productivity savings in Q1, primarily through procurement and SG&A initiatives. We believe prudent expense management leads to maximum operational flexibility. This includes optimizing our footprint and balancing cost reductions against future capacity demands. We will remain disciplined managers of discretionary spending no matter the operating environment.”
3. Guidance Moves and Consensus Shifts
While More Companies Maintained Guidance across Both Revenue and EPS, Upward Adjustments Outpace Downward Moves, and Nearly All Sectors Saw More Analysts Revising EPS Higher
Guidance Moves
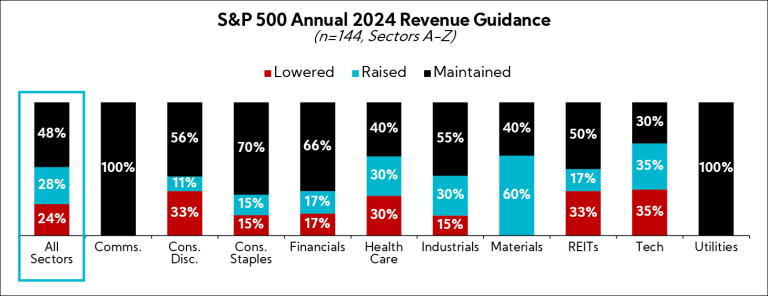
Revenue
- More companies, 48%, Maintained guides relative to last quarter, while 28% Raised and 24% Lowered;
- Midpoints assume 610 bps of growth, on average, and 88% of companies expect year-end results to be above 2023 actuals
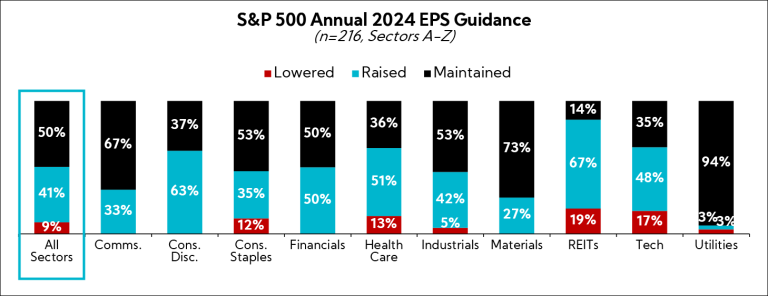
EPS
- Half of all companies Maintained guides relative to last quarter, while 42% Raised and 8% Lowered
- Average EPS spreads decreased $0.03 to an average range of $0.32
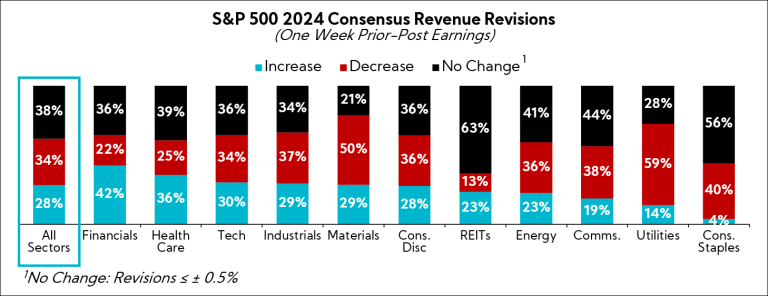
Consensus Shifts
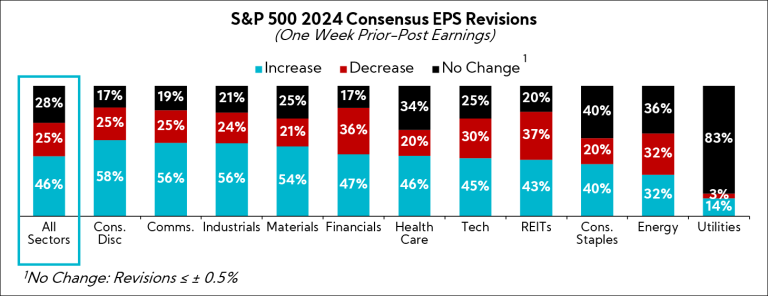
When analyzing full-year consensus shifts of the S&P 500 one week prior through one week post Q1 earnings announcements, analyst estimates reflect a mix of revenue projections alongside stable to improving EPS outlooks.
The proportion of companies experiencing downwardly revised top-line expectations was 34% across all sectors, though more saw estimates maintained (38%). Meanwhile, nearly all sectors saw more EPS estimates raised for companies than lowered, with the exception of Energy, which experienced an equal number, 32%, of increases and decreases.
4. Capital Allocation
QoQ Cash Deployment Trends Reveal Lower Capex Levels in General and Increased Commitment to Buybacks and Debt Paydown; M&A Spend Up Meaningfully YoY
To garner insights into capital trends, we analyzed the average sector allocations within the S&P 500.6
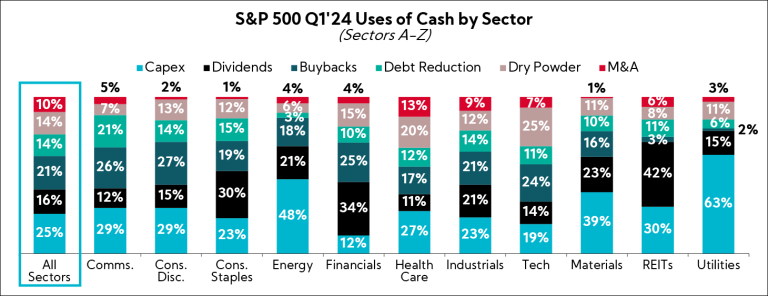
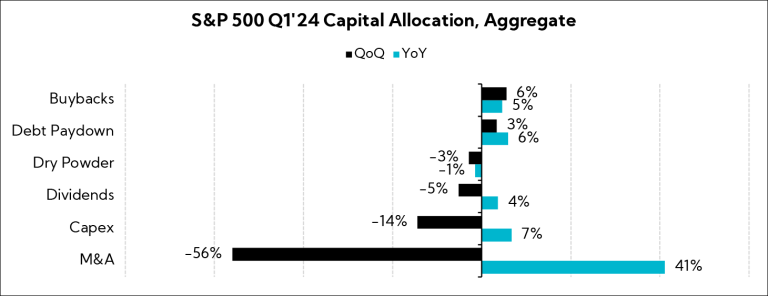
Sequentially, M&A experienced the largest decline (-56%) among the aggregate S&P 500 capital allocation buckets. Driving the large decrease was a steep QoQ comp after three mega-deals from Microsoft, Pfizer, and Amgen7 last quarter dwarfed the overall growth rate for the index. However, YoY, M&A comparisons remain more than 40% higher.
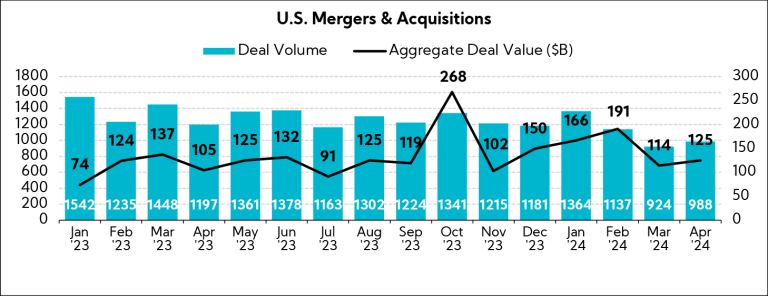
When taking a look at U.S. mergers more broadly, April deal values and volumes both increased versus the prior-month period, 10% and 7%, respectively, and our coverage on U.S. Banks in our Sector Beat this quarter also illuminated notions we are in the “early stages of reopening” as it relates to the deal environment.
As a reminder, our Q1’24 Inside The Buy-Side® Earnings Primer® registered an uptick in investor interest in M&A for the second consecutive quarter, resulting in the highest level of support since Q4’21. Further, we saw signs of softening debt austerity: those favoring a 2.0x or lower net debt-to-EBITDA ratio declined to 57% from the 74% level registered over the past two surveys. Notably, aggregate debt levels for the S&P 500 increased on a sequential and annual basis, 3% and 6%, respectively.
Continuing, while S&P 500 capex increased 7% versus Q1’23 and represented the largest YoY increase out of all capital allocation buckets besides M&A, led by median investment boosts in Materials, Consumer Staples, and Energy sectors, expenditures in Q1 declined 14% sequentially. Still, support for reinvestment remained a close second preferred use of cash behind debt paydown in our latest survey, with continued support for Increasing current levels of growth capex.
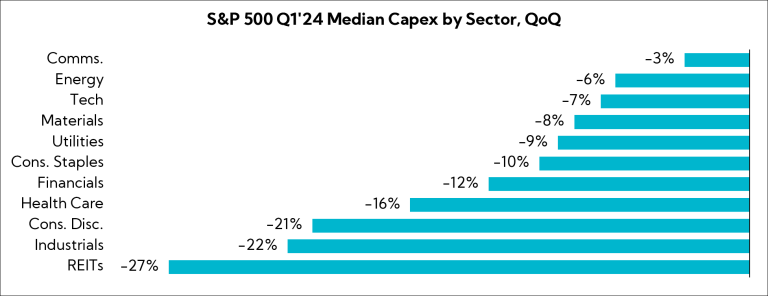
Dividends and dry powder each saw pullbacks QoQ, while buybacks experienced modest increases over both timeframes.
In Closing
For Q1’24, company performances surpassed already strong expectations, particularly on the bottom line, as executives demonstrated their prowess with productivity initiatives. As a result, the Dow hit 40,000 for the first time in history, and the S&P 500 and Nasdaq also hit record highs after encouraging inflation data this week.
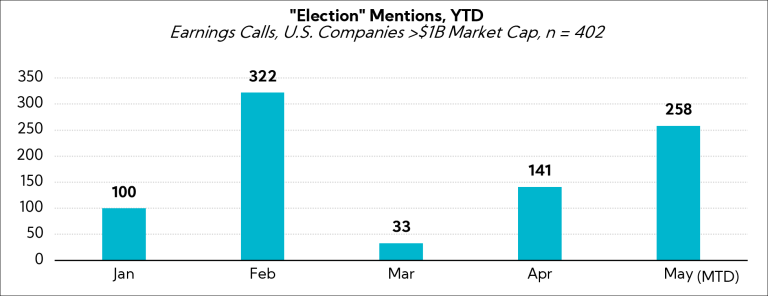
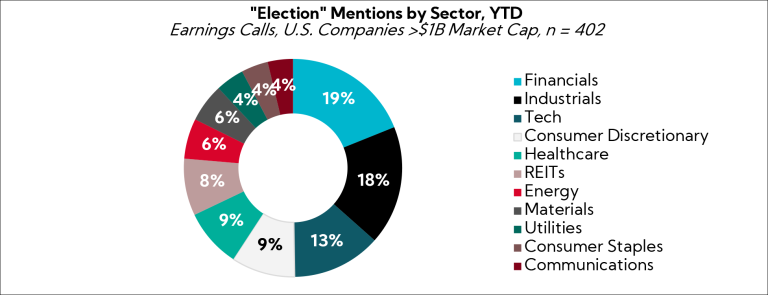
At the same time, fluctuating monetary policy expectations, a seemingly weakened consumer base, and the upcoming U.S. election present notable headwinds.
Regarding the latter, mentions have been a consistent theme across sectors over the prior two earnings periods, with some companies noting the election is impacting customer buying behavior until more certainty is restored.
Internationally, the landscape is equally complex, with significant defense spending being directed toward the Middle East and Europe, coupled with new rounds of tariffs impacting global trade dynamics.
However, executives remain generally optimistic with their outlooks, particularly for the second half. Investor enthusiasm toward the latest round of job growth and inflation figures, buoyed by the relative stability of Q1 earnings, suggests the air continues to get thinner as expectations for 2024 become ever more elevated. Capital allocation trends and sentiment indicate companies are eyeing acquisitions again, and investor tolerance for slightly higher debt loads is increasing. Further, support for maintaining or increasing reinvestment levels in support of growth is high.
Nonetheless, the focus remains squarely on companies’ ability to preserve profitability amid heightened volatility. As we move forward, continued expense management, productivity initiatives, and operational agility will be crucial for satiating growing earnings expectations — as reflected by both guidance and consensus shifts this quarter.
We remain committed to providing timely and actionable insights to help you, our valued clients, successfully stay ahead of the curve. Thank you for your continued trust and partnership!
- Combines actual reported results for companies and estimated results for companies yet to report
- Source: LSEG I/B/E/S (Formerly Refinitiv)
- Source: LSEG I/B/E/S (Formerly Refinitiv)
- As of May 15, 2024
- Based on company guidance provided at the time of publication; total number of companies differ across revenue and EPS
- As of May 15, 2024
- Valued at $65B, $43B, and $27B, respectively, accounting for 71% of the aggregate spending levels in Q4’23