
This Week in Earnings – Q2’24
The Sector Beat: Industirals
In today’s thought leadership, we cover:
- Key Events this week
- Earnings Snap, covering the S&P 500 stats to date
- Selected Insights from our 37th issue of Inside The Buy-Side® Industrial Sentiment Survey®, published last week
- Spotlight on Industrials in The Sector Beat
Key Events
Purchasing Managers’ Index (PMI)
- Flash July S&P Composite PMI came in at the highest level since April of 2022 at 55.0, in line with consensus and mostly unchanged from June’s reading of 54.8. Manufacturing PMI fell to 49.5 from prior reading of 51.6, signaling a deterioration in the goods-producing sector for first time since December. Services posted 56.0 vs. consensus of 55.0. Average prices charged for goods and services rose at the slowest rate since January with some lingering inflation stubbornness in the services sector. (Source: S&P Global)
Interest Rates
- The Bank of Canada cut interest rates by a quarter percentage point for a second consecutive meeting and signaled further easing ahead as inflation worries wane. Policymakers lowered the benchmark overnight rate to 4.5% on Wednesday, as expected by markets and economists. Officials see sluggish growth continuing to cool inflation and said they’re spending more time discussing economic headwinds. (Source: Bloomberg)
- China surprised markets by cutting major short- and long-term interest rates on Monday, its first such broad move since August last year, signaling intent to boost growth in the world’s second-largest economy just days after a Communist Party leadership meeting. The cuts to the central bank’s key short-term policy rate, its market operations rates, and benchmark bank lending rates came after China reported weaker-than-expected Q2 economic data last week and its top leaders met for a plenum that occurs roughly every five years. (Source: Reuters)
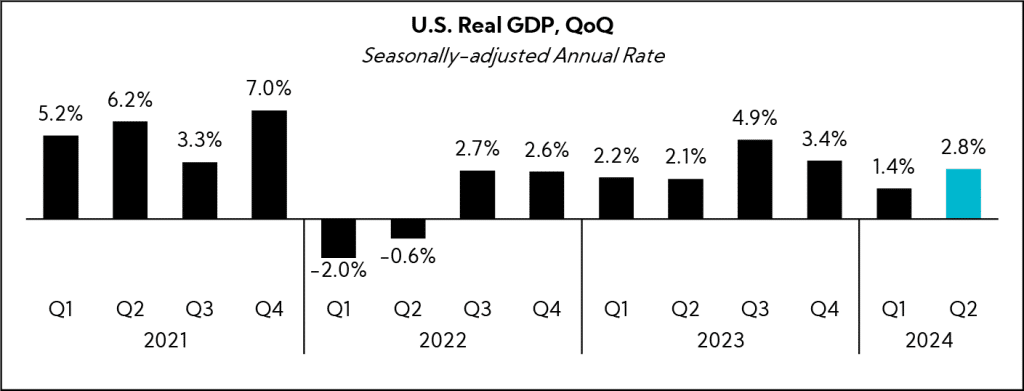
U.S. GDP
- The U.S. economy grew at a 2.8% pace in Q2, above the expected 2.1% annualized increase and following a 1.4% gain in Q1. Consumer spending rose at an inflation-adjusted, annualized rate of 2.3% in Q2, accelerating from Q1 when it rose 1.5%. As well, Americans boosted spending on goods, and business investment also rose at a 5.2% clip, up from the first three months of the year, as companies spent more on equipment. (Source: Commerce Department)
Personal Consumption Expenditures (PCE)
- The PCE price index for June increased 0.1% from the prior month. Core PCE (excl. food and energy) increased 0.2% MoM. From the same month one year ago, the PCE price index increased 2.5%, in line with consensus and down from 2.6% in May. Core PCE rose 2.6% YoY. The report marks the last major inflation data ahead of next week’s FOMC meeting, with the Fed widely expected to stay on hold but potentially open the door to a September rate cut. (Source: U.S. Commerce Department)
Housing
- Sales of previously owned homes dropped 5.4% MoM and YoY, to 3.89M units on a seasonally adjusted, annualized basis to the slowest sales pace since December. Inventory jumped 23.4% from a year ago to 1.32M units at the end of June, coming off record lows but still just a 4.1-month supply. A six-month supply is considered balanced between buyer and seller. (Source: National Association of Realtors)
U.S. Politics
- President Biden officially announced that he will not seek reelection in November and endorsed Vice President Kamala Harris for the Democratic nominee. Harris gained additional key endorsements throughout the week, with an AP survey showing the Vice President is now backed by enough delegates to win the Democratic presidential nomination. (Source: Associated Press)
S&P 500 Earnings Snap
41% of the S&P 500 has reported earnings to date
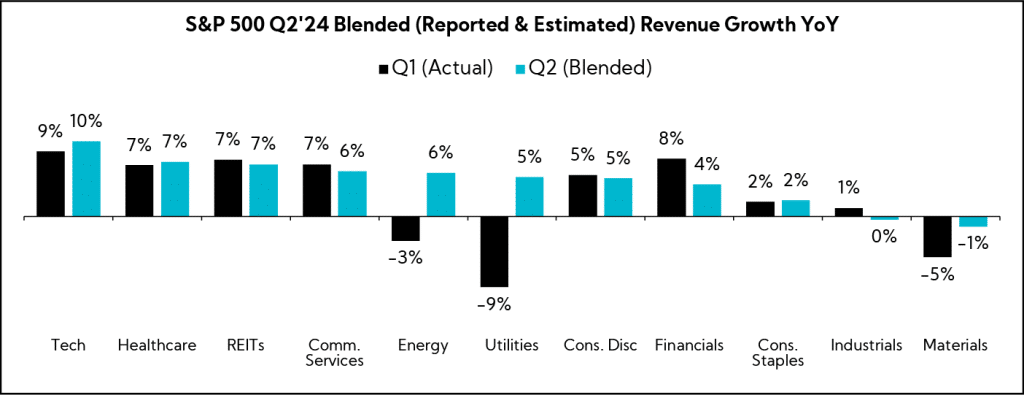
Q2'24 Revenue Performance
- 58% have reported a positive revenue surprise, below the 1-year average (63%) and the 5-year average (69%)
- Blended revenue growth (combines actual reported results for companies and estimated results for companies yet to report) is 4.8%; this compares to last quarter’s 4.5%
- Companies are reporting revenue 1.0% above consensus estimates, below the 1-year average (+1.1%) and the 5-year average (+2.0%)
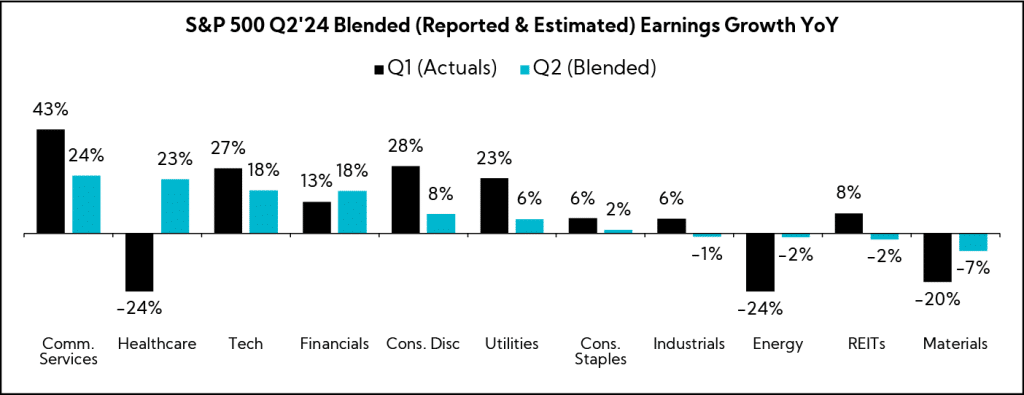
Q2’24 EPS Performance
- 79% have reported a positive EPS surprise, above the 1-year average (78%) and the 5-year average (77%)
- Blended earnings growth (combines actual reported results for companies and estimated results for companies yet to report) is 12.1%; this compares to last quarter’s 10.4%
- Companies are reporting earnings 4.4% above consensus estimates, below the 1-year average (+6.5%) and the 5-year average (+8.6%)
Selected Insights
Inside The Buy-Side® Q2’24 Industrial Sentiment Survey®
Following last quarter’s survey which found a jolt of optimism among respondents amid heightened anticipation of Industrial growth potential, this quarter’s Inside The Buy-Side® Industrial Sentiment Survey® registered a large pullback in sentiment to a more neutral stance overall. While outright bearishness remained limited, those expecting broad-based Industrial weakness doubled in concentration, and survey respondents voiced increased concern over both underlying demand and the sustainability of margins/pricing power.
Based on responses from 37 sector-dedicated participants globally, from June 14 to July 12, 2024, comprising 78% buy side and 22% sell side, and equity assets under management totaling ~$320B, including ~$47 billion invested in Industrials.
Optimistic Investor Sentiment and Perceived Executive Tone Captured in Q1 Pulls Back Hard and Converges in Neutral Territory; While Q2 Expectations Moderate Somewhat, Annual Outlooks Largely Expected to be Maintained (Identified Disconnect)
- 31% characterize current sentiment as Bullish or Neutral to Bullish, down from 68% captured last survey; more investors, 47%, say view is Neutral, up from 19%
- Similarly, just 16% describe executive tone as Bullish or Neutral to Bullish, down from 66% QoQ, with 63% now perceiving talk tracks as Neutral, up 40 pts
- Taken together, the combined level of outright Bullishness is at its lowest level in 20 quarters, though Bearishness remains limited at this time
- 57% and 44% expect Q2’24 results to be In Line with consensus and prior quarter results, respectively; more, 54%, expect performances to be up YoY
- Across Revenue, EPS, Margins, and FCF, most contributors expect Stable to Improving sequential performances; concern regarding Worsening top-and bottom-lines ticks higher
- The majority anticipate companies to Maintain annual guides across all KPIs
- Top areas to address on earnings calls include Margins/Pricing Power, Demand and Order Rates, and Growth
Broad-Based Industrial Weakness Concerns Reignite as 2024 Organic Growth Expectations Deteriorate; Further, while Growth Investment Continues to Receive Meaningful Support and M&A Interest Increases, Dry Powder Endorsement Gains Ground
- 94% expect broad-based industrial weakness, double the concentration registered last quarter
- 60% now expect 2024 Industrial Organic Growth to be Lower than 2023, up from 27% QoQ; those expecting a Higher growth rate declines from 46% to 20%
- As for order rates over the next six months, more contributors anticipate decelerating conditions, particularly for long-cycle products
- 63% believe the U.S. Presidential election is delaying and/or negatively impacting larger capex projects
- Recession/Slowdown, Geopolitical Risks, and Margins are the leading identified concerns this quarter
- Reinvestment remains the preferred use of cash, with 65% in support of Maintaining growth capex
- M&A continues to see increased backing in the #2 position, preferred by 51%; this represents an increase from 44% last quarter and 36% in Q4
- Those supporting Dry Powder (hoarding cash) soars from 5% to 32% QoQ
Nearly All Sub-Sectors See a Steep Rise in Bears; North America Remains the Most Compelling Region, Albeit at Lower Levels QoQ
- North America remains the regional darling for the ninth consecutive quarter, followed by APAC (ex-China) and Europe
- China as a compelling region garners zero support for the second consecutive quarter as risk aversion remains elevated
- 64% continue to assign a High or Very High level of risk to companies with operational exposure, albeit down from 80% QoQ
- Pronounced bearish sentiment exists across nearly all industries, led by Transportation, Ag, Autos, and Building Products, while Defense and Commercial Aero are the only sub-sectors to retain bulls QoQ
The Sector Beat: Industrials
Guidance Trends
Guidance Breakdown by Industry
| Industry | Number of Companies |
|---|---|
| Machinery | 8 |
| Aerospace & Defense | 7 |
| Building Products | 6 |
| Passenger Airlines | 4 |
| Trading Companies & Distributors | 2 |
| Construction & Engineering | 2 |
| Electrical Equipment | 2 |
| Industrial Conglomerates | 1 |
| Professional Services | 1 |
| Air Freight & Logistics | 1 |
| Commercial Services & Supplies | 1 |
| Total | 35 |
Source: Corbin Advisors
Revenue Guidance
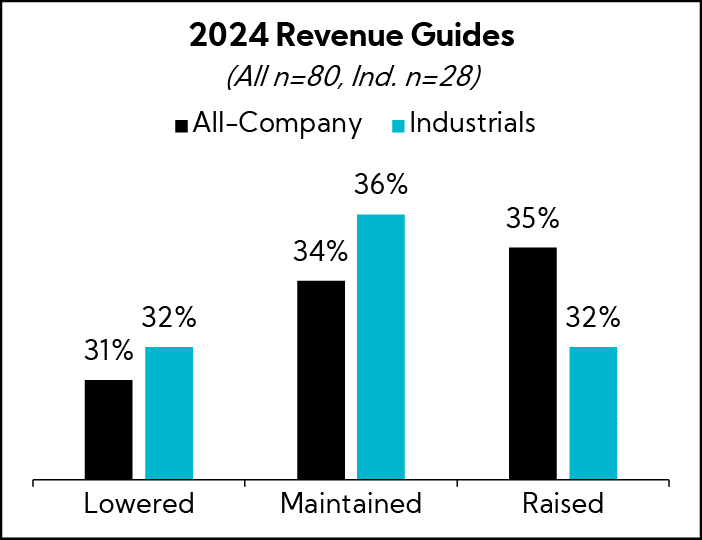
Industrial revenue guides were roughly evenly split, with a slightly higher proclivity toward maintaining annual figures.
Industrial Guidance
- Companies that lowered guidance (n = 9)
- 89% lowered the bottom and top of the original range
- 11% lowered the top, but raised the bottom of the original range (i.e., tightened)
- Average midpoint of 1.0% growth versus 3.1% last quarter
- Average spread decreased by 93 bps to 2.2%
- Companies that maintained guidance (n = 10)
- Average midpoint of 8% growth
- Average spread of 6%
- Companies that raised guidance (n = 9)
- 100% raised the bottom and top of the original range
- Average midpoint of 9.1% growth versus 7.3% last quarter
- Average spread decreased by 20 bps to 1.5%
- Overall midpoints assume 5.8% annual growth vs. 4.9% analyst estimates, on average
- According to our Q2’24 Inside The Buy-Side® Industrial Sentiment Survey®, more investors, 49%, are expecting 2024 Industrial organic growth rates to be In Line with 2023
Annual Revenue Guidance Summary

EPS Guidance
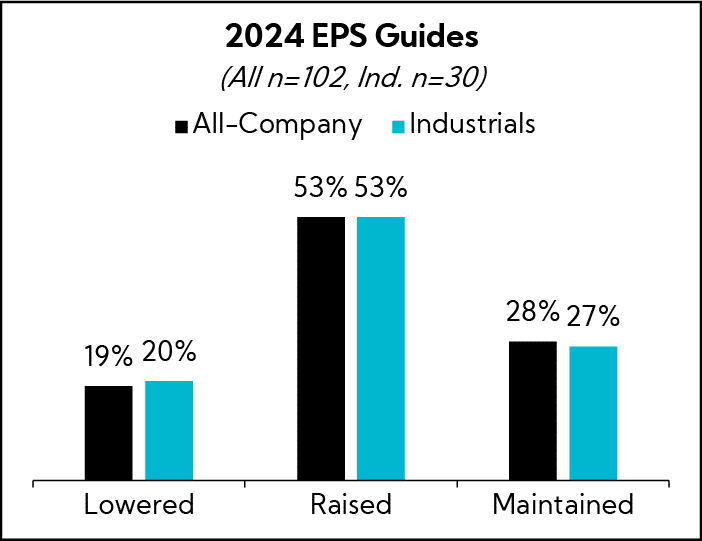
Majority of Industrial companies raised EPS guides, in line with the broader all-company average.
Industrial Guidance
- Companies that lowered guidance (n = 6)
- 100% lowered the bottom and top of the original range
- Average spread decreased from $0.70 to $0.54; excluding airlines, the spread decreased from $030. to $0.16
- Companies that raised guidance (n = 16)
- 81% raised the bottom and top of the original range
- 19% raised the bottom but maintained the top of the original range
- Average spread decreased from $0.36 to $0.30
- Companies that maintained guidance (n = 8)
- Average spread of $0.56; excluding airlines, the average spread is $0.25
Annual Adj. EPS Guidance Summary

Earnings Call Analysis
We also analyzed the earnings calls for this group and the broader Industrial universe to identify key themes.
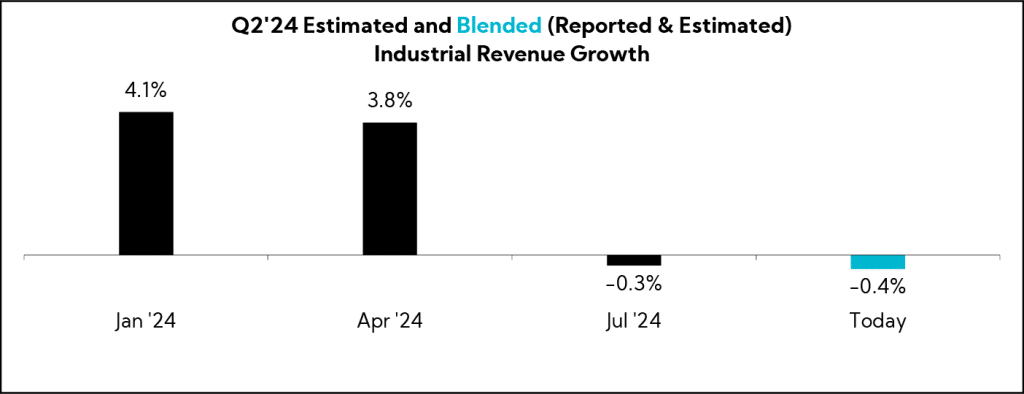
Earnings across the sector have been mixed, with commentary reflecting a cautious tone due to more pronounced macro uncertainty and various idiosyncratic challenges. While EPS beats for the roughly 50% of S&P 500 Industrials that have reported Q2 figures have so far come in at a healthy clip across the sector — 78% have topped consensus, only slightly below the 79% figure for the S&P 500, in aggregate — revenue has been more of a mixed bag. To that end, 50% have posted top-line figures below consensus versus the broader index average of 42%. This comes despite a significant moderation in expectations since the beginning of the year — from YoY growth expectations of 4.1% to actuals of -0.4% currently.
Specifically, Industrials are referencing a more price-sensitive consumer, evidenced by a shift toward lower value and more economical products. The transportation group remains in an unprecedented freight recession, with execs highlighting challenges such as overcapacity, a tough cost/pricing environment, labor action uncertainties, and Red Sea disruptions. On the positive side, West Coast ports continue to see a resurgence in container imports and cargo growth.
As for demand, commentary is mixed by end market, though a bright spot continues to be Aerospace and Defense, with companies reporting strength despite input supply constraints and sluggish deliveries. Continuing, destocking headwinds have also seemingly receded, in line with findings from our Q2’24 Inside The Buy-Side® Industrial Sentiment Survey®. Further, election uncertainty is casting a pall on certain order timeframes, and many are reporting customers taking a “wait-and-see” approach until the election results come in. To that end, many are reporting increasing levels of promotional activity.
Globally, trends are mixed with India and Latin America among pockets of strength. Commentary around Europe notes continued softness, though some highlight early signs of recovery, while sentiment toward China remains downbeat with executives citing pricing pressures and a weak demand environment.
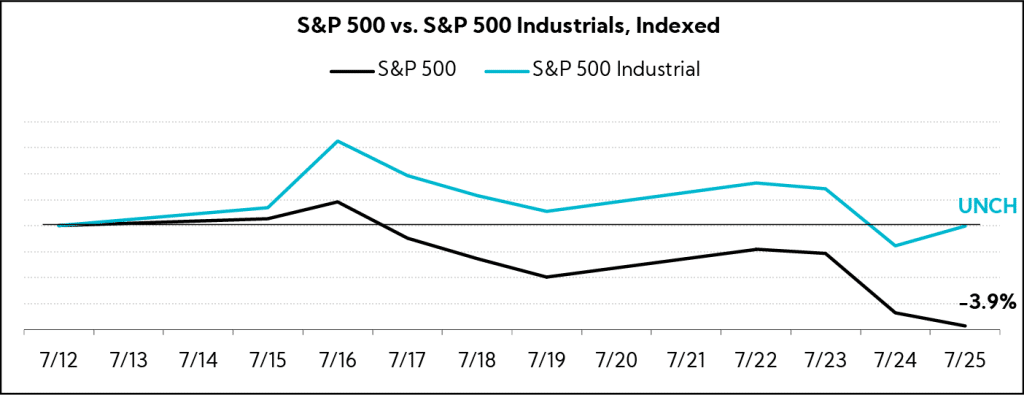
Market Reaction
While the Industrial sector has outperformed the broader S&P 500 on the week2, relative outperformance is partly attributable to disappointing big-tech earnings that have weighed on the cap-weighted benchmark. Industrials thus far are the only S&P 500 sector outside of Materials to post negative top- and bottom-line YoY performances.
Key Earnings Call Themes
Increased Uncertainty and Tighter Spending Rains on the 2H Recovery Parade, but All is Not Gloom; Gov. Stimulus, Inventory Stabilization, and Signs of Improving Economic Measures Give Hope for Brighter Days Ahead
- Snap-On ($14.3B, Tools & Accessories): “The economic trajectory of vehicle repair is quite positive. It’s an attractive place to be. But it’s also clear that while the techs are busy, and have cash, their confidence in the way forward is still poor. Every day, there’s bad news. Two wars with no end in sight. The border unsettled, the shipping lanes disrupted, tit-for-tat with China, lingering inflation, and the election. The election seems to get more unpredictable with every morning news cycle, the hits just keep on coming for bad news for breakfast. It’s almost like the grassroots technicians have a fear of what may happen. And paraphrasing the movie Dune, fear is the outlook killer.”
- Fastenal ($38.9B, Industrial Distribution): “I don’t have a lot of green shoots for you on the macro side. Where we’re accelerating though is on the self-help side. In the 1H24, we were feeling the impact of relatively low signings in 2023. I think in the 2H24, you’re going to begin to feel the benefits of the stronger signings.”
- J.B. Hunt ($16.8B, Integrated Freight & Logistics): “Our last two years have been the most difficult time in my 30-year career. It’s been the most difficult time in predicting and understanding where our customers are headed and how we need to think about that from a quarter-to-quarter basis. But we are very focused on [the] long term.”
- Wabash National ($0.9B, Farm & Heavy Construction Equipment): “Turning to market conditions, we see pockets of both strength and weakness. But on balance, I believe there’s optimism about what lies ahead. Our drive end customers have had little relief from the ongoing freight recession. Although the truckload market seems to be experiencing a return to normal seasonality, a positive waypoint on the path to recovery. That said, customers have still revised their capital expenditure plans downwards for the balance of this year. The unfolding reality of 2024 is certainly at odds with how most of the back half of 2024 would bring moderate improvements in both demand within the freight market, as well as freight rates. While important macro indicators like industrial production have turned positive and inventory levels have moved from a state of excess to balance, it will take some time for these supporting factors to manifest in the freight markets.”
- Valmont Industries ($6.6B, Conglomerates): “The outlook for transportation remains strong, driven by a national priority to upgrade and expand critical infrastructure. We expect IIJA funding to provide a solid tailwindto project financing for years to come, despite labor shortages and funding delays slowing project build outs in the near term.”
- United Parcel Service ($109.7B, Integrated Freight & Logistics): “Given the current volume momentum we are now experiencing in our business, we are resetting our revenue guidance, taking us to the midpoint of our original revenue guide. But for operating profit, as we look to the back half of the year, in the US, we expect the same volume mix characteristics as we had in the first half of the year, which compresses revenue per piece growth. While we still expect an operating profit back up effect, with solid earnings growth in the back half of the year, the growth rate will not be as high as we projected at the beginning of the year.”
“Tumultuous” U.S. Election Compounds Weakening Customer Demand, Anemic Domestic Freight, Increased Promotional Activity, and Supply Chain Issues; Aerospace & Defense Remains a Bright Spot
- Masco ($16.4B, Building Products & Equipment): “Overall, sales…for the first half of the year [were] down LSD. As uncertainty within the broader macroeconomic environment has continued, we are tempering our expectations for sales in the second half of the year from up LSD to roughly flat.”
- Knight-Swift Transportation Holdings ($7.9B, Trucking): “Domestic inland freight demand has yet to show the strength seen in the ocean container market, and the ongoing attrition of excess trucking capacity added during the upcycle still has further to go. Freight rates have largely stabilized, but at unsustainable levels.”
- AO Smith ($12.0B, Specialty Industrial Machinery): “It’s a very competitive market. Consumer demand is weaker than it’s been. And so…consumers are a bit cautious. We’re seeing a bit more promotional activity. We saw it in Q1, and that’s carried over into Q2 as well.”
- United Parcel Service ($109.7B, Integrated Freight & Logistics): “When you look at the domestic volume performance from Q2 and then going forward…we did see customers favoring our more economical products — so going from air to ground and, within ground, from ground to SurePost. That was across the broad base of customers.”
- Lockheed Martin ($123.7B, Aerospace & Defense): “Demand for our defense technology solutions remains robust with a backlog of nearly $160B, greater than 2x our annual revenue. Our strong performance so far in 2024 extends beyond backlog as well, giving us confidence to raise our 2024 full year outlook for sales, segment operating profit, and EPS.”
- RTX Corp ($152.9B, Aerospace & Defense): “As you’ve seen, the first half performance across all three of our businesses has been strong, driven by the strongest demand environment in our history and continued execution. There are, of course, a few areas we continue to monitor, including pockets of supply chain challenges, inflation and the ongoing OE production rate uncertainty.”
Election
- General Dynamics ($78.0B, Aerospace & Defense): “We typically see in any U.S. presidential election a slowdown around the election. And I think this won’t be any different.“
- Valmont Industries ($6.6B, Conglomerates): “Election years could be weird for consumer behavior, so we are watching out for all of that. We built all that uncertainty into our second half guide to try and reflect that.”
- Herc Holdings ($4.3B, Rental & Leasing Services): “The political environment right now is probably the most tumultuous political environment that I can recollect in my career. And it’s certainly having an impact. And we’ve heard a fair amount of customers taking a wait-and-see until the election results come in.”
- Republic Services ($62.8B, Waste Management): “There’ll be puts and takes, whether there is an administration change, and there’ll certainly be a new President, whether that’s a party change or not. And in general, the conventional wisdom is the Republican administration is going to be more business-friendly and Democratic one maybe…less business-friendly. If you look at the last three years, our business has performed really well in the context of a Democratic administration.“
- Old Dominion Freight Line ($42.3B, Trucking): “Obviously anytime there’s an election year that creates uncertainty. It usually puts pressure on the overall shipping environment. And we’ve seen that this year on top of a slower industrial economy, in general. So, that’s something that will just be one more measure of uncertainty that will soon be put to bed whatever direction it goes.”
Margins Pressured by Dwindling Pricing Power amid Persistent Inflation, Notably in Labor; Still, EPS Guides Remain Intact, and Executives Highlight Value Propositions and Flexible Cost Structures
- Ryanair Holdings ($21.5B, Airlines): “There is no doubt that the consumer is more price sensitive. I’ve talked to one of the long-haul carriers a week ago [who] told me that transatlantic is softer this year than it was last year. Everything just points to consumer spending being a little bit softer than we had expected. The reality is that during June, and now into July and August, close-in pricing is materially weaker. It is down where it was prior year.”
- AO Smith ($12.0B, Specialty Industrial Machinery): “It’s a tough market, and as we’ve said, we’re cautious about even our guidance. But our team is doing a terrific job balancing not only pricing promotion, but also the cost of our business. We talked way back when we went through the pandemic, a lot of our costs are now more variable than they are fixed. And so, we’re just balancing it.”
- Apogee Enterprises ($1.4B, Building Products & Equipment): “Primarily what we see is we see a lot of pricing pressure as volume is softening. End market demand is putting pressure on volumes. We’re trying to titrate our pricing and it’s getting pushed down. And so, we think there is going to be some pressure on pricing that’s going to push down margins consecutively as we look at the rest of the quarters sequentially in the year.”
- Honeywell ($132.1B, Conglomerates): “Labor is and will remain a highly elevated inflation category for us.”
- Union Pacific ($144.3B, Railroads): “[Labor] inflation is still probably running around that 5% level that we talked to coming into the year. We’ve got a 4.5% wage increase that became effective. It’s the last one in this round of negotiations…effective July 1 for our craft professionals. So I don’t see a lot changing there. It’s just some moving pieces and parts and we’re trying to find areas where we can try to mitigate that either through our productivity, through our purchasing, and how we’re just running the road in general. This is what’s going into the cost structure. And we need to go out there, have those tough conversations, and the team is doing that.”
- MSC Industrial Direct ($4.6B, Industrial Distribution): “On the one hand, you have a little bit stickier inflation, which should buoy the pricing environment. On the other hand, the competitive environment is intense when it’s soft. I will say, in a lot of ways, that plays really well into our value proposition.”
- Old Dominion Freight Line ($43.0B, Trucking): “We’ve had a lot of other incremental inflationary items, things like the cost of our equipment, maintenance costs that have been up double digits on a per mile basis the last few years, and insurance costs that are a problem for the industry that have been up double digits for multiple years in a row. All of those things we continue with and that’s why there’s got to be an ongoing focus on operating efficiency in discretionary spending.”
- United Parcel Service ($109.7B, Integrated Freight & Logistics): “We’re competing in a rational pricing environment today. And I think about it in three segments. One [is] our digital access program, where we have the ability to leverage the architecture of tomorrow. And the way to think about it, the technology gets dynamic pricing across all customer segments and all channels. So, we’ve leveraged it to win in the digital access program.”
As Noted in our Recent Industrial Sentiment Survey®, Destocking Reported to Be Largely in the Rearview; Commentary Suggests Low Inventory Levels and Balanced Sell-in/Sell-out Ratios
- PACCAR ($52.4B, Farm & Heavy Construction Machinery): “From an inventory standpoint, the industry is at 3.9 months of retail sales and PACCAR is at a very healthy 3.3 months. Things feel quite good for us in terms of inventory with the share growth we’re realizing.”
- Carlisle ($19.7B, Building Products & Equipment): “There wasn’t a big load-in this year. People were burned on the inventory. We had to destock. We’re through that. Coming into this year, we didn’t expect a big load-in. We actually were prepared and had built a little bit more in the first quarter to be sure we could address customer needs with having lower inventory through the channel. So, I don’t see that inventory picking up, as we go into the third quarter because we’re past the peak of the construction season, so why would you load in inventory now.”
- Carrier Global Corporation ($19.6B, Building Products & Equipment): “If you look at the sales guide up HSD, we have an easy compare as we get into 4Q, but we still see very strong growth as we get into sales in 4Q, partly because of the order book, partly because the inventory levels out there are very low. They’re down a little over 10% YoY. And it’s nice to see sell-in, sell-out is about equal. So, any kind of debate over destocking, we feel confident that’s behind us.”
- Lennox International ($19.6B, Building Products & Equipment): “I still think there could be a meaningful amount of people building up inventory just because of uncertainty and the history of some of the manufacturers who don’t always get this transition right. But higher rate environment means we didn’t bake in a lot around pre-buy and anything else in our forecast. But if the industry starts not meeting demand or there’s some disruption that’s coming in there, distributors are typically risk-averse, and they will start building up inventory. Capital is still available, it just costs a little more.”
- Hexcel Corp ($5.1B, Aerospace & Defense): “I think that OEMs pulling from the supply chain at higher rates than their deliveries is part of what’s happening right now as the OEMs are ensuring that the supply chain can continue to get stable and to improve their efficiency, so as production rates go up, they’re ready to do it. What the OEMs are doing is prudent, and it’s going to help improve the stability and the financial and operational strength of the supply chain.”
Reshoring Trends Driven by Infrastructure Spending Continue in the Americas, While the Red Sea Conflict, and Other Idiosyncratic Issues, Such as Potential Rail and Port Labor Issues, Continue to Stymie Normalization
- United Parcel Service ($109.7B, Integrated Freight & Logistics): “In the Americas region, we continue to see solid signs of the shift to nearshoring. As we see the shift to nearshoring continue to take hold, our announced acquisition of Estafeta will further enhance our end-to-end services in Mexico.”
- PACCAR ($52.4B, Farm & Heavy Construction Machinery): “With the infrastructure spending that’s just getting really going in the U.S. and the amount of reshoring that seems to be happening, that bodes well for a strong vocational market for a while. And there have been supply constraints in the vocational side of the market.”
- FedEx ($73.8B, Integrated Freight & Logistics): “Shippers are facing tightened capacity both in air and sea freight services. Red Sea disruptions have further exacerbated shipper challenges from Asia to Europe.”
- Canadian National Railway ($73.1B, Railroads): “Overall volumes came in on plan but not exactly in the way that we expected. We were tracking well ahead of the plan overall up until the third week in May driven by a growth in international, as well as frac sand, petroleum and chemicals, and a late rush on Canadian grain to Vancouver. From a volume outlook perspective, the mere potential of rail and port labor disruptions dampened overseas intermodal volumes starting in June, and we expect that to continue until the labor uncertainty is resolved.”
- J.B. Hunt ($16.8B, Integrated Freight & Logistics): “On the demand side, Q2 felt more like what we’re accustomed to seeing prior to the pandemic disruption. April started a little slower from a demand perspective, primarily due to the timing of Easter, but we did experience what used to be a typical end-of-month and end-of-quarter lift in June. That said, some customers have pulled a portion of their peak freight forward a couple of months, given the multiple macro factors that could impact the supply chain later this year. This pull-forward has created an early peak on the water, but that hasn’t translated into domestic inland moves just yet.”
- Lockheed Martin ($123.3B, Aerospace & Defense): “As far as supply chain, we did see improvement. We are seeing continued improvement there and on time delivery. The part shortages continue to come down. Having said that, there are still areas where we’re ramping up major programs. We have deployed and we continue to deploy personnel to provide on-site assistance at suppliers. I’d say by and large we are seeing an improvement in the supply chain which gives us confidence for that continued growth in the future.”
- GE Aerospace ($180.3B, Aerospace & Defense): “While we’ve made progress in services this quarter, our new engine output was disappointing, down 20% sequentially. It’s a clear challenge that we’re facing head-on, accelerating the use of FLIGHT DECK in partnership with our suppliers as we work to solve the ongoing supply chain constraints.”
- Hexcel Corp ($5.1B, Aerospace & Defense): “As we look ahead to the second half of 2024, some of our Commercial Aerospace customers are flagging continued challenges in the aerospace supply chain and slowing previously communicated production rate increases. Notably, on June 24, Airbus signaled a reduction in deliveries for 2024 from 800 to 770 aircraft, indicating it would impact all programs, including, importantly for Hexcel, the A350, which is our largest individual program. Boeing deliveries have also been below plan for the first half of the year.”
Europe Remains Soft though Signs of Recovery are Evident for Some, Softer-than-Expected Weakness Prevails in China, while India and LatAm are Relative Bright Spots
Europe
- Ryanair Holdings ($21.5B, Airlines): “We look around and we see consumer spending under pressure all over Europe.”
- PACCAR ($52.4B, Farm & Heavy Construction Machinery): “The market in Europe is down, we’re seeing some pricing pressure there. Looking at the U.S. and Canadian truck market, the vocational segment remains strong with continued infrastructure investments. In Europe, economies in the truck market are softer this year.”
- Simpson Manufacturing ($7.6B, Lumber & Wood Production): “The market in Europe remains under pressure due to weak economic growth and higher interest rates, reducing overall construction activity.”
- Graco ($14.5B, Industrials): “In EMEA, activity has slowed, with some projects either being delayed or shifted to future quarters. We expect the operating environment in both EMEA and Asia Pacific to remain tough for the remainder of the year.”
- Honeywell ($132.1B, Conglomerates): “In Europe, we’re seeing recovery. We have seen good revenue progression for Honeywell in first half of the year. So, probably the bottom is behind us and that’s how we are looking at times ahead for Europe for us.”
- Masco ($16.4B, Building Products & Equipment): “In local currency, International Plumbing sales decreased 1%, driven by unfavorable mix, partially offset by pricing actions and favorable volume as we continue to see signs of stabilization in our key markets of Europe and China.”
China
- Graco ($14.5B, Industrials): “Asia Pacific was weak, but as you know, China is a big chunk of it for us. And China in particular has been weaker than what we had hoped it would be. When I look at the incoming order rates and the levels of activity in Asia Pacific…compared to last year, it is lower than what we had, which was orders were much higher in particular in some of those industries.”
- AO Smith ($12.0B, Specialty Industrial Machinery): “In China, we believe the economy and consumer confidence remain weak. We continue to see headwinds in consumer demand.”
- General Motors ($50.1B, Auto Manufacturers): “We had expected to return to profitability in China in Q2. However, we reported a loss and we expect the rest of the year will remain challenging because the headwinds are not easing. Very few people are making money, and a lot of OEMs are prioritizing production over profitability. We have been more disciplined than most in our pricing. We are launching some new vehicles that we’re seeing positive traction, but it’s a difficult market right now.”
- Fortive ($24.9B, Scientific & Technical Instruments): “We’re not seeing the recovery in China we had anticipated. As you know, the Chinese government put a number of incentives into play at the end of the first quarter. One of those around replacement investments we thought would get more traction in the economy, and it hasn’t.”
- Otis Worldwide ($38.2B, Specialty Industrial Machinery): “China remains under intense price pressure, and although pricing in China was down YoY, it came in approximately flat sequentially.”
India and LatAm
- Veralto ($26.2B, Pollution & Treatment Controls): “We continue to see strong growth in Latin America and India.”
- PACCAR ($52.4B, Farm & Heavy Construction Machinery): “One of the things you can see that’s really helpful to us is the strength in South America and Brazil specifically, another place where market share has grown significantly.”
- Fortive ($9B, Scientific & Technical Instruments): “India was a little slow in the quarter, but we see good India growth the rest of the year.”
In Closing
This quarter, companies across sectors are feeling very similar trends: slowing top lines; customer decisions being pushed out; an anemic consumer; labor issues, including wage inflation, unionization, and inefficiency; and continued or emerging supply chain issues.
A tale of two cities is emerging in Industrials. While softer-than-expected top-line growth is prevalent, bifurcated margin performances are apparent: those that are holding / expanding and those that are seeing outsized revenue losses lead to erosion.
As we continue to advise — don’t own the macro, but report factually what you are seeing in your end markets. Reinforce strategy, execution, and ability to control the controllables. This too shall pass and when demand is restored, companies will be better positioned than ever to capture the operating leverage.
If there is one lesson to be learned from the past 4-year cycle, it’s that balance is best.
In case you missed it, you can access the link below for a replay of our webinar The Big So What™ – Q2’24 Earnings Season.

- As of 7/25/24
- As of 7/25/24, Source: FactSet