
Closing the Quarter – Q3’24
In today’s thought leadership, we cover:
- Key Events this week
- Closing the Quarter Summary — Q3’24 performance, guidance moves and consensus shifts, capital allocation, U.S. election implications for investor communication strategies, and an activist uptick
Key Events
Inflation
- Consumer prices in October rose 2.6% from a year earlier. While in line with expectations, this marks a pickup from the previous month, when the CPI was up 2.4%. Core prices, which exclude food and energy items in an effort to better reflect inflation’s underlying trend, were up 3.3%. Both were in line with expectations. (Source: Bureau of Labor Statistics)
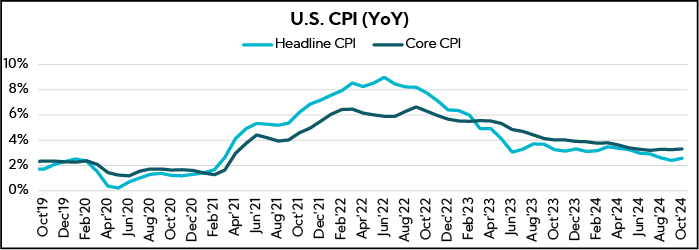
- The producer price index, which measures what producers get for their products, increased a seasonally adjusted 0.2% for the month, up one-tenth of a percentage point from September. On a 12-month basis, headline wholesale inflation was at 2.4%. Excluding food and energy, core PPI rose 0.3%, also one-tenth more than last month. The 12-month rate was at 3.1%. Both again were in line with expectations. (Source: Bureau of Labor Statistics)
Retail Sales
- U.S. retail sales rose 0.4% MoM in October, ahead of 0.3% consensus, but down from September’s 0.8% pace, which was upwardly revised from 0.4% reported last month. Control group sales (excl. autos, gas, building materials, and food services) dipped 0.1% last month after an upwardly revised 1.2% gain in September. The so-called control group sales, which correspond most closely with the consumer spending component of GDP, were previously reported to have risen 0.7% in September. (Source: Commerce Department, Reuters)
Labor
- Initial jobless claims, a proxy for layoffs, totaled 217,000 for the week ended Nov. 9, down 4,000 from the previous period and slightly lower than the 220,000 estimate, which shows that the pace of layoffs continued to moderate after a brief spike. (Source: Labor Department)
U.S. Politics
- After winning the presidential election and securing a majority in the Senate last week, the Republican party confirmed a clean sweep with outlets reporting on Thursday that the GOP has secured the needed 218 seats to maintain control of the House. (Source: Associated Press)
- Donald Trump announced a series of cabinet appointments, including Susie Wiles as White House Chief of Staff, the first woman – Republican or Democrat – to hold the position. Marco Rubio was tabbed for Secretary of State. Press takeaways highlight unconventional picks with Trump largely sticking with loyalists, while some may face a challenge getting confirmed, most notably Matt Gaetz as Attorney General and Robert F. Kennedy Jr. as Health and Human Services Secretary. (Source: WSJ, Reuters, CBS News)
Closing the Quarter Summary
Heading into earnings season, our Q3’24 Inside The Buy-Side® Earnings Primer® survey, published October 10, registered a notable divergence in sentiment resulting in a bull-bear barbell, with fewer investors expecting earnings results to be In Line with consensus, while those anticipating beats and misses both increased notably QoQ. Adding to the already complicated macro landscape, the November election in the U.S. weighed heavily on the minds of investors coming into reporting season. Indeed, over half of respondents cited U.S. politics and election uncertainty as their leading concern, leapfrogging geopolitics. Worries about consumer health remained prevalent, while unemployment and stretched valuations emerged as watchouts.
That said, amid interest rate cuts, AI-driven demand, and expectations for “varied” earnings prints, a solid majority reported being Net Buyers or Rotating, with mid-caps seen as the most compelling investment opportunity of all the sizes. Finally, investors were confident that a Trump win would support equity market gains.
With Q3’24 earnings in the books, we “Close the Quarter” with some notable themes:
- Earnings Performance
- Guidance Moves and Consensus Shifts
- Capital Allocation
- U.S. Election Impact
- Activism on the Rise
1. Earnings Performance
Q3 Earnings Prints Surprised to the Upside, though Top-Line Beats Settled Well Below the 5-Year Average
Overall, Q3 prints fared better than expected on the bottom line, though revenue performances were more mixed, similar to Q2.
With over 92% of S&P 500 companies reporting earnings to date, the index is reporting YoY blended1 earnings growth of 8.8%, 3.5% above the estimated rate heading into earnings (5.3% as of 10/1/24). Notably, 76% reported a positive EPS surprise, slightly below the 5-year average of 77%.
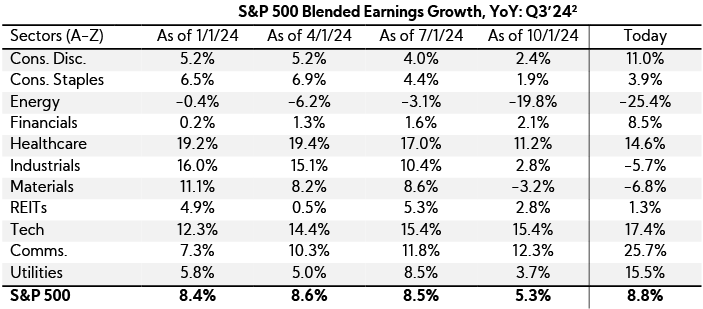
As for revenue, only 61% have reported positive top-line surprises, below the 5-year average of 69%, with prints 1.6% above consensus estimates, again below the 5-year average of 2.0%. At least 30% of companies within the Index missed revenue consensus this quarter across all sectors, save for REITs (29%), Healthcare (20%), and Tech (13%). Meanwhile, four sectors have had more than 50% of companies miss top-line estimates: Materials (64%), Utilities (63%), Consumer Discretionary (52%), and Industrials (52%).
2. Guidance Moves and Consensus Shifts
Slightly Fewer Companies Raised EPS Guidance QoQ While Upward Analyst Revisions Outweigh Decreases; Top-Line Expectations Are Mixed, with Growth Midpoints Increasing, on Average
Guidance Moves
We analyzed annual revenue and EPS guidance trends across the S&P 500.3 Below are our findings.4
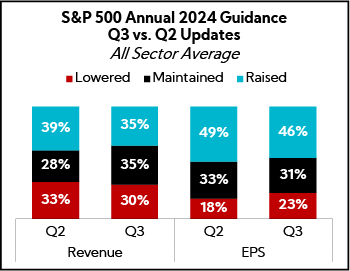
Overall, annual revenue guides saw mixed trends; while more than one-third of companies Raised guidance, fewer did so this quarter, with a shift toward companies Maintaining guides (+7 pts QoQ). EPS saw a slight increase in the proportion of companies Lowering guides (+5 pts QoQ), but over 45% Raised.
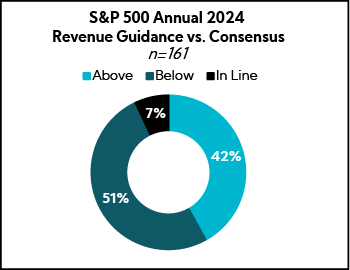
Revenue:
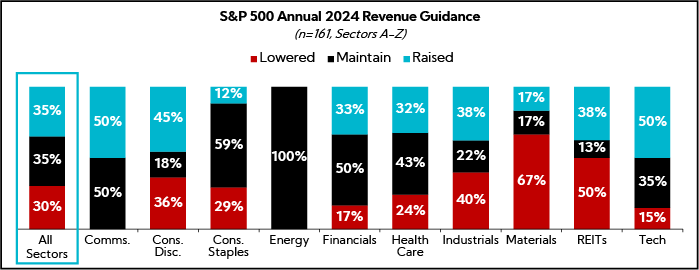
Fewer companies Raised annual guides, 35%, while 30% Lowered and 35% Maintained; midpoints assume 5.5% growth, on average, up from 5.3% QoQ
- Notably, 83% of companies expect full-year 2024 results to be above 2023 actuals, up from 81% last quarter
- Tech and Communication Services led the way in guidance raises, while Materials, REITs, and Industrials saw the highest percentages lowering
EPS:
Albeit down from last quarter, nearly half of companies, 46%, Raised annual guides, while 31% Maintained and 23% Lowered; average EPS spreads decreased $0.05 to $0.20
- Tech, Consumer Discretionary, and Financials saw the highest percentage raising, while REITs and Energy had the highest percentage lowering
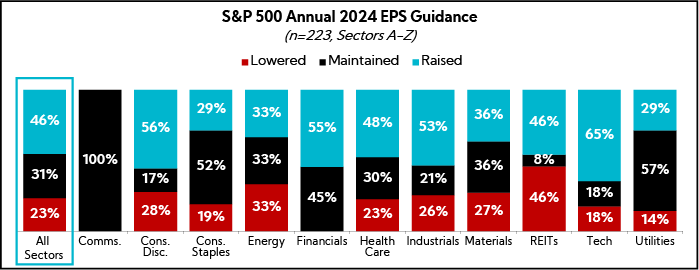
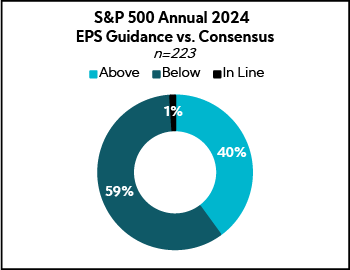
While more companies have raised EPS guidance, these still appear fairly conservative relative to consensus. Among the 45% of companies that increased EPS guides, 61% still project figures below consensus estimates. Similarly, most company forecasts for annual revenue and EPS fall short of analyst expectations, although at least one-third exceed them.
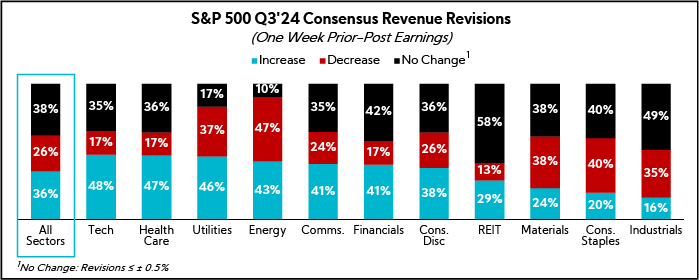
Consensus Shifts
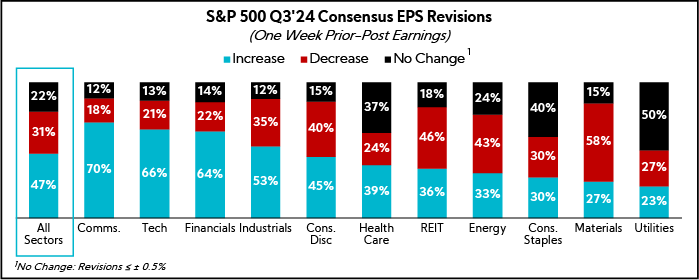
When reviewing full-year 2024 consensus changes for the S&P 500 from one week before to one week after Q3 earnings announcements, analyst estimates reveal mixed revenue projections, but generally improving EPS outlooks.
For revenue, overall revisions were fairly balanced, with 38% of estimates maintained, 36% increased, and 26% decreased. Notably, Energy, Materials, Consumer Staples, and Industrials saw more companies facing downward revenue revisions than increases.
On the other hand, most sectors saw more companies with raised EPS estimates, 47%, than lowered, 31%. Exceptions included REITs, Materials, Energy, and Utilities, which experienced more EPS downward revisions than raises.
Combining both metrics, Energy and Materials stood out with a majority of downward revisions for both revenue and EPS, while Communication Services, Technology, and Financials had the largest upward revisions across both categories.
3. Capital Allocation
QoQ Cash Deployment Trends Reveal a Notable M&A Pick-up Alongside Positive Capex Momentum; Dividend and Buyback Levels Dipped QoQ, While Dry Powder Ticked Up but Remained Below Year-ago Levels
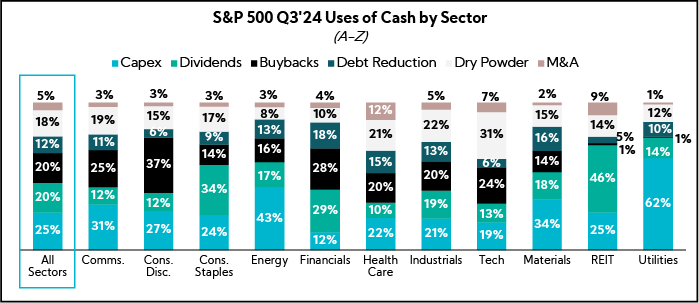
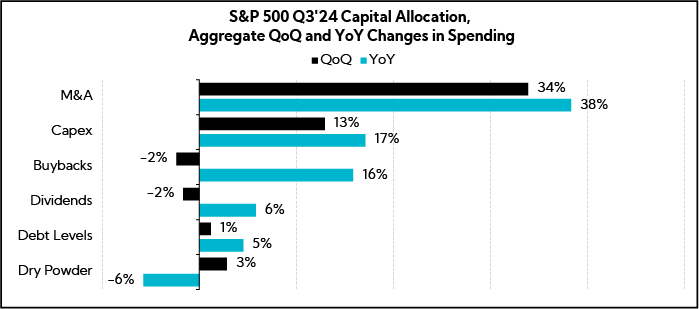
On a QoQ and YoY basis, S&P 500 M&A was higher by 34% and 38%, respectively, while capex also so increases of 13% QoQ and 17% YoY. In contrast, both buybacks and dividends, despite rising YoY, declined slightly QoQ by 2%, potentially indicating a subtle shift toward growth-oriented strategies. Notably, dry powder experienced the largest YoY decline, down 6%, as companies appear to be increasing spending on growth initiatives.
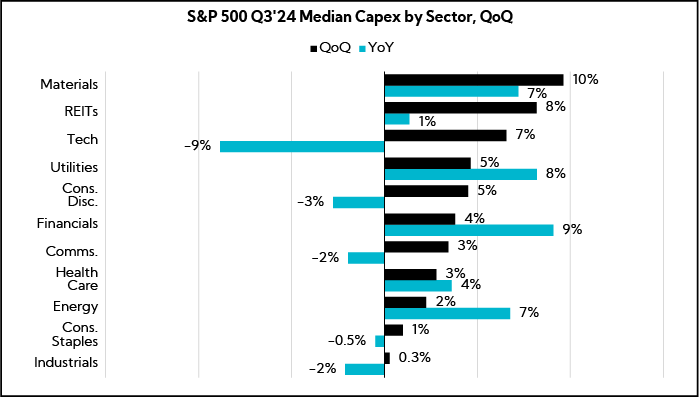
Indeed, every sector saw an increase in capex spending QoQ, with the largest median increases observed in Materials, REITs, and Technology. According to our latest Q3’24 Inside the Buy-Side® Earnings Primer® survey, investor sentiment toward growth capex remains highly supportive, with the majority of participants favoring either maintaining or increasing current investment levels.
Continuing, M&A emerged as the most significant portion of spending this quarter on an aggregate basis, highlighting a strategic focus on growth through acquisitions. This is in line with the findings from our Q3’24 Inside the Buy-Side® Earnings Primer® survey, which highlighted a 10% increase in M&A as a preferred use of cash by investors, while preferences for building dry powder decreased by 9%.
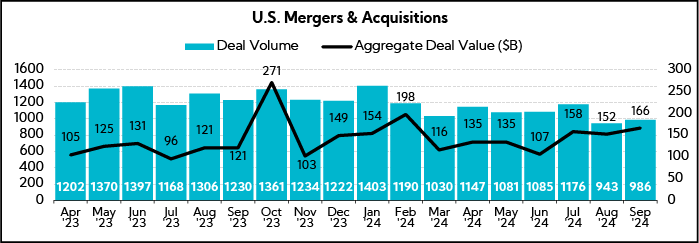
Looking more broadly at U.S. mergers, September deal values and volumes rose 9% and 5%, respectively, compared to the prior month. On a YoY basis, deal values surged by an impressive 37%, even as deal volumes fell by 20%, pointing to a trend of fewer but larger deals.
4. U.S. Election Impact
While a Trump Win Removed Near-term Election Uncertainty, Unknowns Abound as Focus Shifts to Policy Ramifications
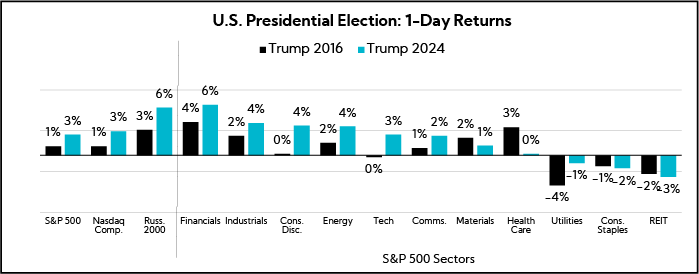
As noted last week, investors received a dose of clarity on Nov. 5 with Donald Trump winning the U.S. election by a definitive margin (312-226 electoral votes). Market reaction was swift, with stocks rallying on Nov. 6 with the S&P 500 posting its best post-Election Day performance on record, while the VIX, Wall Street’s “fear gauge”, fell more than 20%. At the same time, commentators and sell-side analysts were quick to highlight potential policy implications under a Trump 2.0 administration, including key considerations for companies and investors on both the headwind and tailwind sides of the ledger.
On the positive side, analysts broadly point to expectations for a looser regulatory environment, lower corporate taxes, and pro-domestic growth policies, with banks, big tech, short-cycle industrials, and smaller, more domestically focused U.S. companies perceived among the key beneficiaries. Not surprisingly, the Financial sector, and particularly regional banks, saw some of the biggest knee-jerk moves to the upside, with the KBWR Regional Banking ETF surging 13.6%. At the same time, the Russell 2000 small-cap benchmark jumped nearly 6%. Analysts also pointed out echoes of 2016, with many of the same “Trump Trades” en vogue, but with moves more pronounced this time around. Goldman Sachs noted its Cyclicals vs. Defensives basket pair rose by 6%, its largest one-day increase since March 2020, reflecting market expectations for a better U.S. economic growth outlook.
Of note, though Consumer Discretionary rose post-election, much of that was driven by Tesla shares rallying ~15% given Elon Musk’s close ties with Trump, while the specter of steep China tariffs weighed on apparel and consumer goods companies with a manufacturing presence in China. For instance, toymakers Hasbro and Mattel saw their shares drop 5% and 7% on the day, respectively.
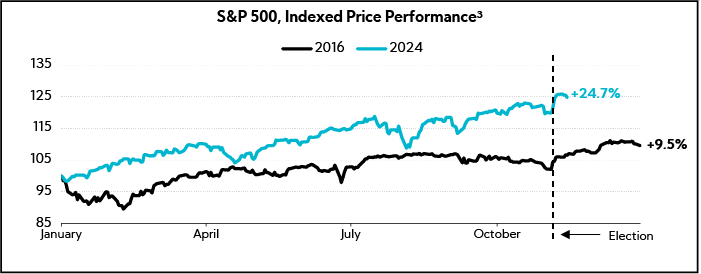
At the same time, many have also noted that Trump inherits a vastly different market environment relative to 2016, with the S&P 500 having posted its best YTD performance for an election year (up 20%+ heading into the election), compared with a less than 5% YTD gain at the time of the 2016 election.
Meanwhile, a Trump 2.0 presidency will be contending with a higher interest rate backdrop and inflation still well above the Fed’s 2% target. To that end, analysts are flagging policy proposals such as aggressive tariffs that could put further upward pressure on prices, as well as an expected immigration crackdown that could stifle growth and present labor challenges for many sectors if implemented.
As highlighted in last week’s Thought Leadership, “tariff” mentions during earnings calls have spiked of late. With Trump floating the idea of a 20% blanket tariff globally, and as high as 60% for China, trade concerns and tariff implications are sure to remain top of mind for investors in the coming months.
Indeed, several companies have already indicated plans to either shift production or raise prices if Trump’s plans are implemented. Footwear maker Steve Madden said on Nov. 7 that the company plans to slash its percentage of goods sourced from China by 40-45% over the next year. Elsewhere, Stanley Black & Decker, in a Nov. 12 filing,6 disclosed that it estimates proposed China tariffs could erode its pretax operating income by $200M a year, noting the company is preparing to discuss price increases with its customers and has begun supply chain adjustments.
While the immediate election aftermath reflects a degree of relief with the removal of one near-term overhang for markets, many questions remain as to what government policy will ultimately look like as we move into 2025. Indeed, if markets crave certainty, Trump has proven to be inherently unpredictable, with some of his early cabinet nominees already causing a stir in Washington7. Despite optimistic headlines about the potential for a better business environment and a return of “animal spirits”, it’s too early to know how things will unfold around key issues such as trade, tax reform, and immigration, not to mention what a Trump 2.0 presidency will mean for an already tumultuous geopolitical landscape.
Selected Examples of Common Analyst Questions Post-Election
Nov. 6 – Sunoco ($7.0B, Oil & Gas Refining & Marketing)
- Question: “Following the [election] results, what are your views on how the apparent Trump victory impacts your business or changes the landscape of the industry in general?”
- Answer: “All things considered, it was a very positive event for Sunoco and the sector going forward. I would add one other [bit of] perspective. If you look at it over longer time period, we’ve performed well within various administrations, [including] COVID and other macro factors, and there’s a good reason why. Our business is resilient because we perform critical functions and we own critical infrastructure that keeps America healthy and moving forward.”
Nov. 6 – Jack Henry & Associates ($12.7B, Information Technology Services)
- Question: ”In the wake of the election, could you remind us how Jack Henry is impacted by consolidation from an underlying revenue growth perspective? And obviously it’s very early, but whether this cycle should be any different than what we’ve seen historically?”
- Answer: “I don’t think the election results will change much of what we have baked for 2025. We have a president that we’ve seen before, so we know a little bit more of his playbook and what we should expect related to regulatory, and hopefully some improvement in the timing of M&A.”
Nov. 6 – Schneider National ($5.4B, Trucking)
- Question: ”As we look forward, is there any talk amongst your customer base about another potential pull-forward ahead of tariffs in light of the election results? And what do you think that might look like? Has enough capacity come out that that could be a more structural tightening event? How are you thinking through some of those dynamics?”
- Answer: “At this point, we haven’t had many discussions with our customers about an additional pull forward relative to tariffs. Not that it won’t happen, but that would happen at a faster pace than what we would normally see, as currently our customers are really operating under normal replenishment cycle, preparing for this holiday push. So, it’s something that still could be out there ahead of us.”
Nov. 7 – Enersys ($3.9B, Electrical Equipment & Parts)
- Question: “We had a little bit of political news in the last couple of days… With the outlook for tariffs and the implications for developing a strong domestic manufacturing base, the gigafactory probably makes more sense than ever before from a strategic standpoint. But on the funding and development side, help us understand what the schedule should look like. How could this transition in administration impact both the finalization and the timing on funding of the contract?”
- Answer: “There are probably very few things that are agreed upon in D.C. these days, but one of those seems to be the importance of a domestic supply chain, especially for defense-related products. So, it’s a huge priority for the current administration and we anticipate that to continue as we transition.”
5. Activism on the Rise
Q3 Saw Its Share of High-profile Activist Campaigns as Overall Activity Remains Elevated, with Q4 Momentum Continuing
A recent publication from Barclays8 noted that through Q3, the number of activist campaigns globally was running 26% above the 4-year average. Given ongoing macro uncertainty and continued focus on cost-cutting and operational efficiency measures, the current environment is rife for activists in search of targets.
Just this week, industrial conglomerate Honeywell was targeted by well-known activist investor Elliott Management, which disclosed it had amassed a more than $5B stake and issued a letter to the board.
In its letter, the firm contends that “the conglomerate structure that once suited Honeywell no longer does, and the time has come to embrace simplification.” Elliott is calling for Honeywell to separate into two standalone companies — Honeywell Aerospace and Honeywell Automation — arguing that it could result in share price upside of 51-75% over the next two years.
While this is the latest example in a multi-year shift in investor preference away from the conglomerate model towards simplification, it underscores the need (perhaps now more than ever) for companies, particularly those with multiple businesses of scale, to clearly articulate the strategic rationale of the portfolio in order to secure investor buy-in.
Indeed, our earlier research into this topic found Industrials among the most heavily targeted sectors by activists. Further, our Voice of Investor® research identified company profiles most commonly receiving the greatest buy-in to the multi-segment or conglomerate approach.
For a deeper dive, read the full report: Investor Views on Multi-segment Companies
In addition to the rise in activist campaigns, there has also been an increase in companies targeted by short seller reports in recent months. Our internal tracking shows that since the start of Q3, at least 27 U.S.-listed public companies have been the subject of short seller reports. While these reports are frequently misleading, their prevalence bears watching and further highlights the need to keep your pulse on investor sentiment, engage with the Street, and get ahead of any potential investor misperceptions…essentially, be your own worst critic.
Further, as noted in a prior Corbin thought leadership publication, not all short reports are created equal. Consequently, when advising clients on how to respond, our approach will always be customized and vary on a case-by-case basis. See our research, Navigating Short Reports, for a deeper dive into this topic, including best practices and recommendations.
In Closing
As we wrap up our coverage of Q3’24 earnings season, it’s clear that macro uncertainty remains top of mind with commentary heavily influenced by the U.S. election, questions around the path of Fed rate cuts, and heightened geopolitical turmoil. While we now have the election behind us, it will take time to gain clarity around what policy changes will be enacted once Trump enters the White House at the end of January.
At the same time, as we observed throughout the quarter, while the U.S. economy has proven resilient by most measures, manufacturing activity remains in the doldrums and many sectors continue to navigate a challenging demand environment globally.
While the timing of a demand inflection is anyone’s guess, you can bolster investor confidence by clearly articulating steps taken to navigate the current backdrop and position for an eventual turn. As we have said for years now, “don’t own the macro” and “control what you can control”.
As always, we remain dedicated to providing you with timely insights and actionable strategies to navigate the ever-changing and complex environment.
- Combines actual reported results for companies and estimated results for companies yet to report
- Source: LSEG I/B/E/S (Formerly Refinitiv)
- As of November 14, 2024
- Based on company guidance provided at the time of publication; total number of companies differ across revenue and EPS
- As of November 14, 2024; “All Sectors” figures are equal weighted sector averages
- Stanley Black & Decker 8-K
- Source: WSJ: “Trump Sends Shock Waves Through Washington With Gaetz Pick”
- Source: Barclays Investment Bank: “2024 activism boosted by new campaigners and US activity”