
Closing the Quarter — Q2’23
In today’s thought leadership, we cover:
- Key Events this week
- Closing the Quarter heading into Q2 earnings, our Q2’23 Inside The Buy-Side® Earnings Primer® found investor views converging with those of management.
2023 Outlook and Macro – as we continue through August, executives have provided thoughts on anticipated trends for the remainder of 2023
Key Events
Retail Sales
- Advanced estimates of U.S. retail and food service sales for July came in at $696.4B, up 0.7% MoM and 3.2% YoY. Total sales for the May through July 2023 period were up 2.3% versus the same period in 2022. (Source: U.S. Census Bureau)
Housing
- The U.S. Census released its new residential construction report indicating 1.452M privately-owned housing starts occurred in July, a 3.9% increase MoMand 5.9% increase YoY; building permits clocked in at 1.442M, a 0.1% increase MoM and 13.0% decrease YoY. (Source: U.S. Census Bureau)
- On Thursday, the average mortgage rate hit 7.09%, the highest in more than 20 years, causing would-be buyers to sit on the sidelines while simultaneously crunching the housing supply as would-be sellers are unwilling to put homes on the market, fearful of giving up low-rate mortgages. (Source: WSJ)
- Facing its first monthly decline in the past eight months, builder confidence retreated largely because of rising mortgage rates and high shelter inflation, an issue that accounted for 90% of the July Consumer Price Index reading of 3.2%. (Source: National Association of Home Builders)
Empire State Manufacturing Survey
- Business activity declined in New York state, as new orders and shipments fell significantly. Delivery times were steady, and inventories moved lower. Labor market indicators point to steady employment but a shorter average work week. Conversely capital spending plans firmed somewhat, and firms grew more optimistic about the six-month outlook. (Source: Federal Reserve Bank of New York)
China
- On Tuesday, Chinese officials declared they would stop reporting the country’s youth unemployment rate after months of spiraling increases, depriving investors and economists another key data point. This comes in stride with the People’s Bank of China announcing it lowered the interest rate on one-year loans to banks while adding ~$55.2B of new loans into the banking system. (Source: WSJ)
- On Thursday, Chinese real estate giant Evergrande Group filed for Chapter 15 bankruptcy protection in New York as part of one of the world’s biggest debt restructurings as anxiety grows over China’s worsening property crisis and its impact on the weakening economy. (Source: Reuters)
Closing the Quarter Summary
Heading into Q2 earnings, our Q2’23 Inside The Buy-Side® Earnings Primer® found investor views converging with those of management. Bearish investor sentiment receded while management tone was perceived as increasingly cautionary, resulting in a more neutral outlook, collectively. Capital deployment preferences overwhelmingly favored debt paydown for companies with net debt-to-EBITDA levels above 2.0x, though reinvestment continued to garner increasing support QoQ.
With Q2 2023 earnings season in the books, we “Close the Quarter” with some notable themes:
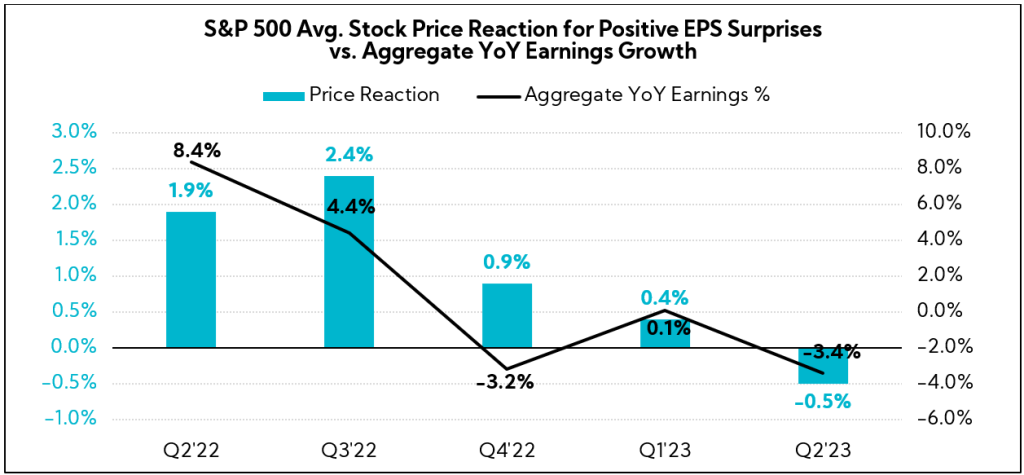
1. Earnings beats are holding less weight in the current environment
Despite 79% of the S&P 500 reporting positive EPS surprises, above both the 1-year (73%) and 5-year averages (77%), stock price reactions for those surpassing analyst estimates have been negative1, on average. Although the average surprise factor for Q2 clocked in at +7.8% above consensus, below the 5-year average (+8.4%) but above the 10-year average +(6.4%), positive surprises were met with an average share price depreciation of -0.5%. Interestingly, if -0.5% is the final percentage for the quarter, it will mark the largest average negative price reaction to positive EPS surprises reported by S&P 500 companies for a quarter since Q2 2011 (-2.1%)2.
Why the apathy?
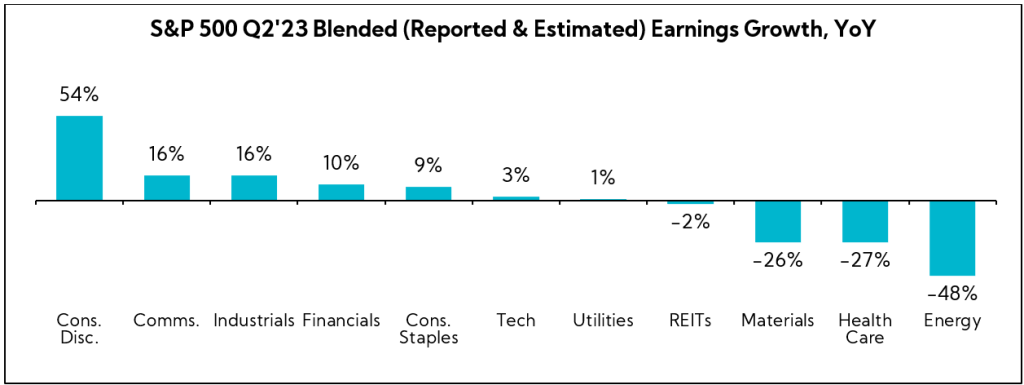
- Despite the quarterly “positive surprises”, the index reported its largest annual earnings decline since Q3 2020 (-3.4% aggregate YoY earnings growth vs. -5.7% in Q3 2020), partially dragged down by EPS declines in Materials (-26%), Health Care (-27%), and Energy (-48%).
- Nearly 30% of analysts recently lowered EPS estimates for the remainder of the year despite conservative guidance going into 2023.
- There was some “sell-the-news” happening after earnings reports, since many stocks had rebounded YTD through the end of July.
Put another way, implied expectations were much higher in July than they were in January, yet the Street’s growth estimates in aggregate remained muted post-Q2 earnings.
2. Smaller-cap companies received more attention recently from investors, but outperformance in the stock market still largely revolves around the biggest names YTD
However, market breadth did improve during July, when the Russell 2000 outperformed the S&P 500 by 3%. Some of this had to do with bounces in the lagging regional bank stocks mentioned above, as investors temporarily looked past worst-case scenarios post the SVB collapse, and more broadly, some renewed confidence that a hard economic landing might be averted. Meanwhile, inflation, while still somewhat sticky, continued to step down in a relatively orderly fashion.
That said, August has reversed that outperformance to the point where the S&P 500 and Russell 2000 indices are now neck-and-neck since the beginning of July. Nevertheless, this compares with an 8% performance gap between the Russell 2000 and S&P 500 since our prior publication in mid-May, representing some improvement in market breadth versus 1H23.

3. Companies with greater international exposure have produced sub-par results when compared to their domestically focused counterparts. In particular, those with more China exposure have fundamentally underperformed the rest of the group, with price reactions serving as a poignant indicator as of late
When splitting the S&P 500 universe into:
- Companies with greater than 50% of their revenues originating in the U.S.
- The remainder, which have more international than U.S. exposure4, the first bucket of domestically focused companies fared better on both their top- and bottom-line Q2 prints
As shown below, aggregate YoY revenue declined 6.5% for companies with greater than 50% of their revenues coming from abroad compared to a 3.2% increase for those with larger U.S. revenue sources.
Additionally, aggregate EPS growth declined 5.0% for those in the international camp versus a 1.9% uptick for companies in the U.S camp. Of note, the WSJ Dollar Index5 ended largely flat for the calendar Q2 period, increasing just 0.8% and currently registers down 1.0% YTD.

When digging a layer deeper, the data suggests that greater China exposure in particular more negatively impacted Q2 growth rates. When parsing the S&P 500 into those with at least 5% of revenues coming from China and, further, those with at least 20% exposure, stark disparities begin to emerge.
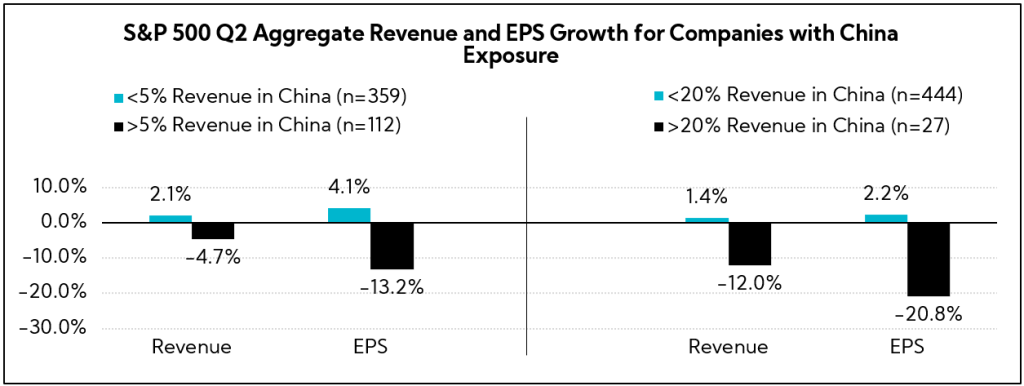
In fact, investor sentiment reflects this reality. Heading into Q2 earnings, our Inside The Buy-Side® Earnings Primer® identified souring China sentiment, with 79% of participants exhibiting more concern or a continued high level of concern over U.S.-China relations. Moreover, the perceived risk profile for companies with operational exposure to the country increased to 82% after hovering ~70% over the past year, with sentiment toward the Chinese economy recording its largest level of bearishness since March 2022, according to our Earnings Primer® (the height of the Chinese Communist Party’s Zero-COVID policy measures).
During the entirety of Q2 2023, the average stock price reaction6 to earnings reports for companies with >20% of revenues coming from China was relatively similar compared to the broader S&P 500 average (-0.9% versus -0.4%, respectively). However, share performances since the beginning of August are increasingly reflecting more concern around China exposure, as this differential cited above has widened during August to 6%.
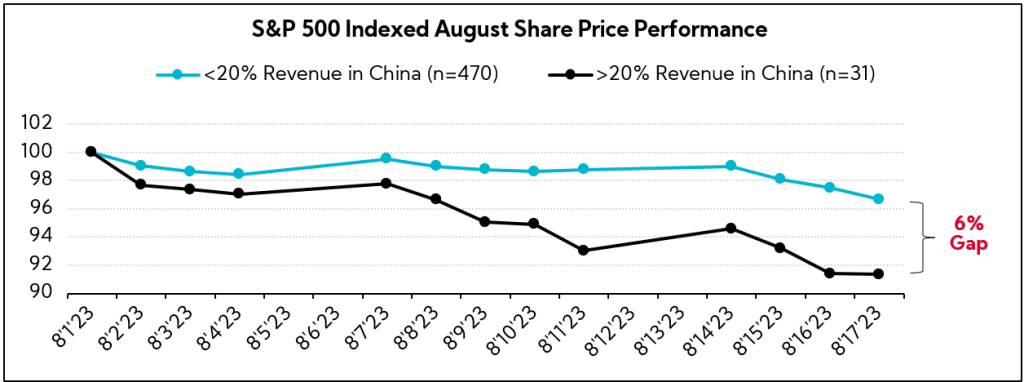
Contributing factors include: the People’s Bank of China unexpectedly cutting rates on Tuesday in an effort to spur consumer activity, a flurry of weaker-than-expected economic indicators published last week (namely, Chinese retail sales, investment, and industrial output), the suspension of their youth jobless data, which hit a record high of 21.3% in June, and continued tensions in U.S.-China relations, with new tariffs introduced as recently as Thursday.
Time will tell how these China-heavy companies perform in the back half of 2023. For now, investor sentiment, executive commentary, and policymaking in Washington appear to point to less-than-ideal fundamentals and deteriorating sentiment for companies with exposure to China.
Key Economic Indicators

Guidance Trends
As we do every quarter, we analyzed annual revenue and EPS guidance provided by U.S. companies with market caps greater than $500M that have reported to-date.9 Below are our findings:10
Breakdown by Sector

Annual Revenue Guidance Deep Dive
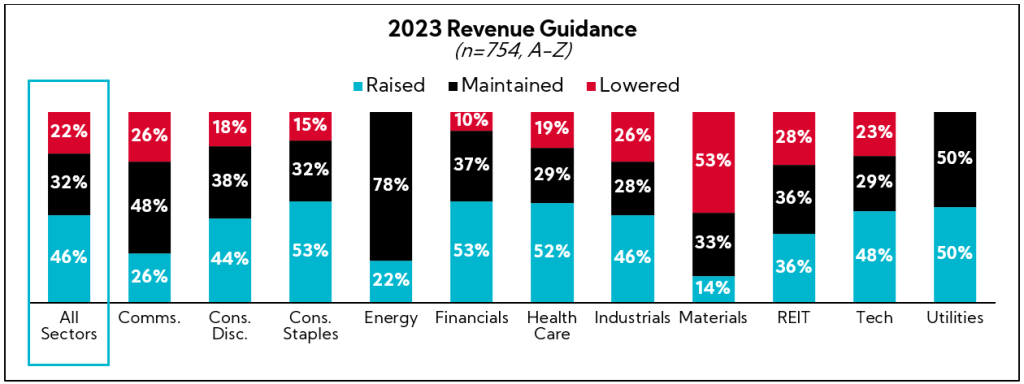
81% of full-year 2023 revenue growth guidance midpoints are above 2022 actuals, down slightly from 83% last quarter.

80% of companies who raised annual revenue guidance increased both the bottom and top of their ranges, while 79% of those who lowered decreased both the top and bottom of their ranges.
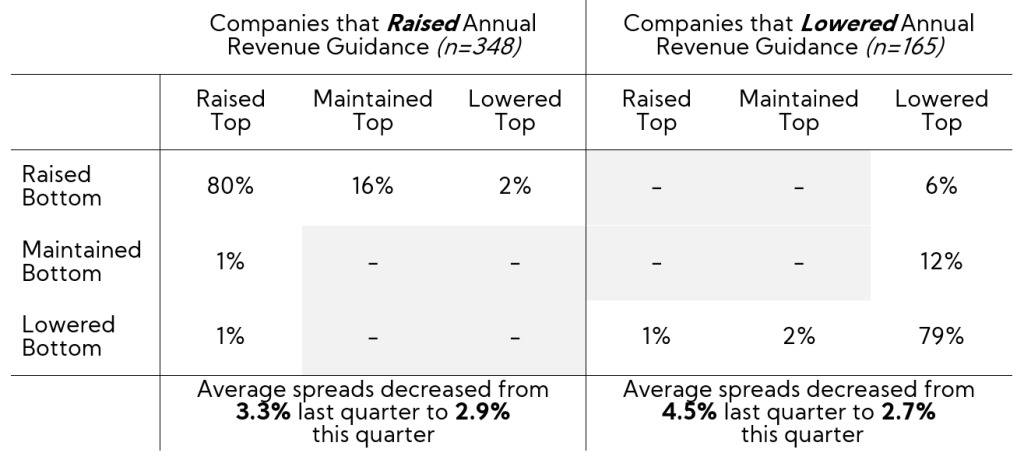
Companies that maintained annual revenue guidance (n = 241) have an average spread of 4.2%.
Annual EPS Guidance Deep Dive
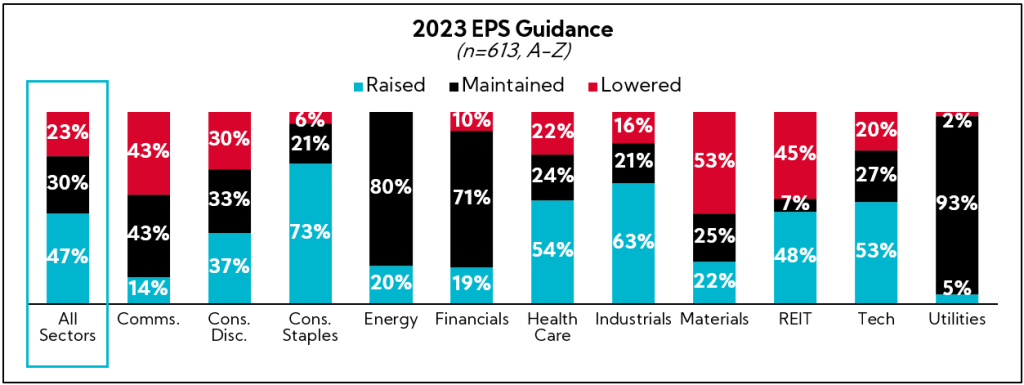
61% of full-year 2023 EPS growth guide midpoints are above 2022 actuals, just below 62% last quarter.

81% of companies who raised annual EPS guidance increased both the bottom and top of their ranges, while 84% of those who lowered decreased both the top and bottom of their ranges.
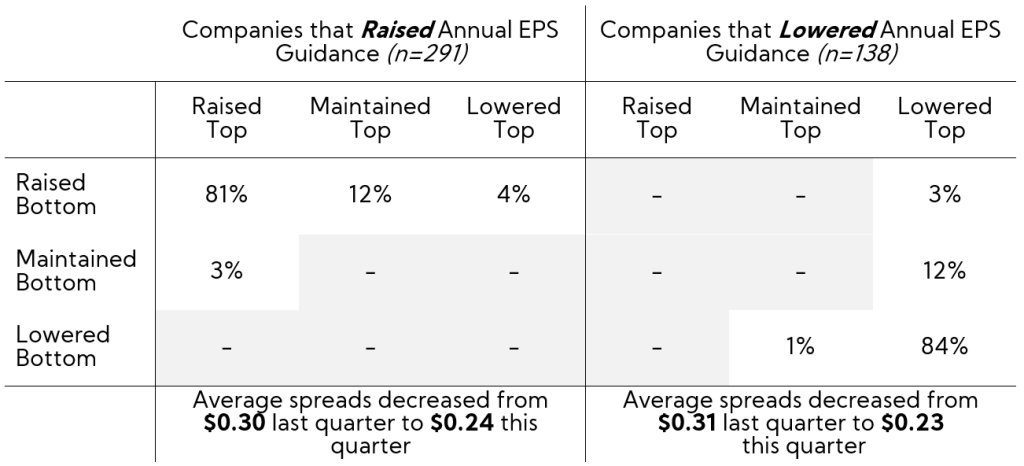
Companies that maintained annual EPS guidance (n = 184) have an average spread of $0.28.
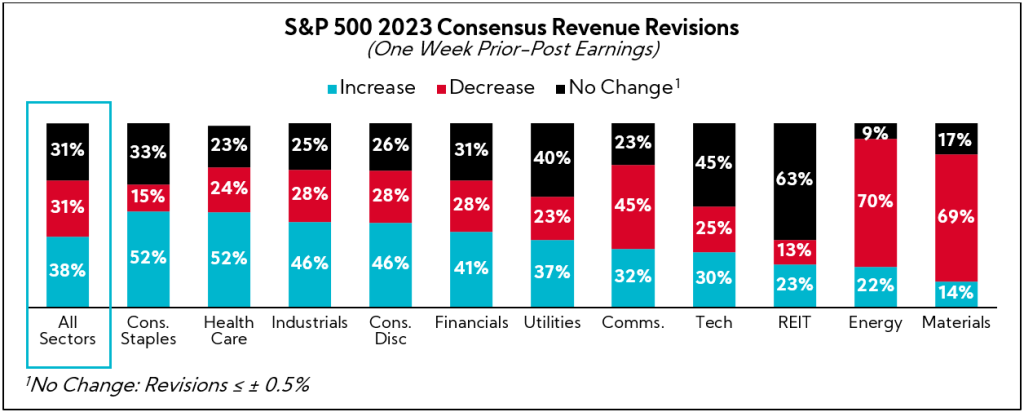
Analyst Consensus Trends
Approximately 38% of analysts increased 2023 top-line estimates, while half increased EPS expectations for the same period. Leading the revenue increases were defensive sectors, including Consumer Staples and Healthcare, while Energy and Materials experienced the largest top- and bottom-line cuts amid changes in commodity price assumptions.
Indeed, roughly 30% of all sectors experienced negative annual consensus revisions for both revenue and EPS.

Capital Allocation
To garner insights into capital spending trends, we analyzed the average sector cash allocations within the S&P 500:
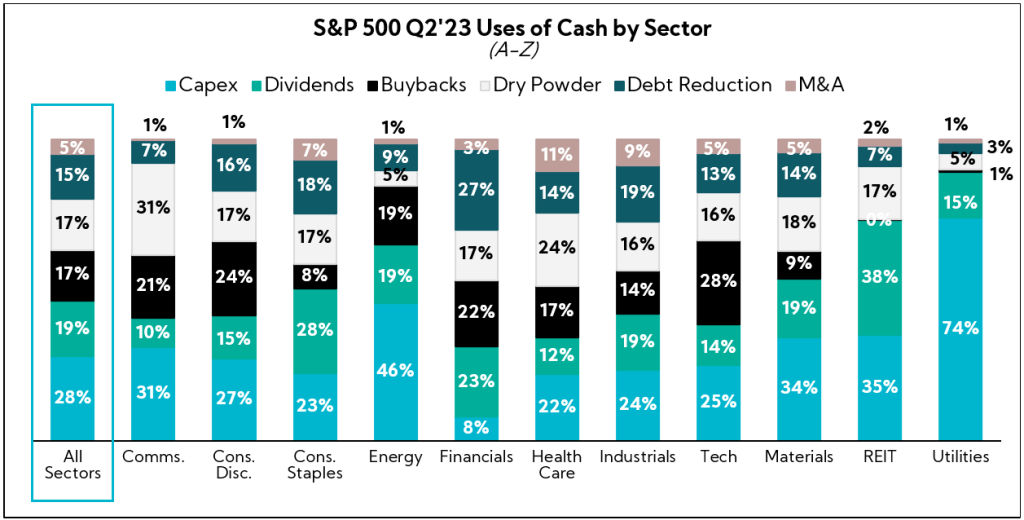
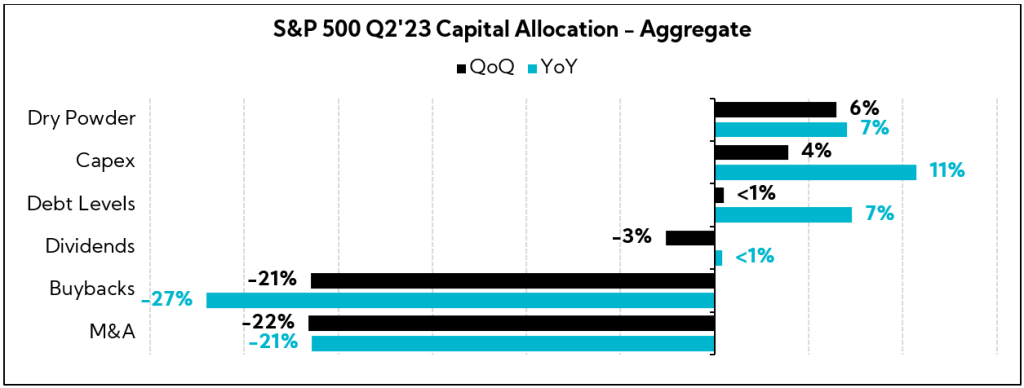
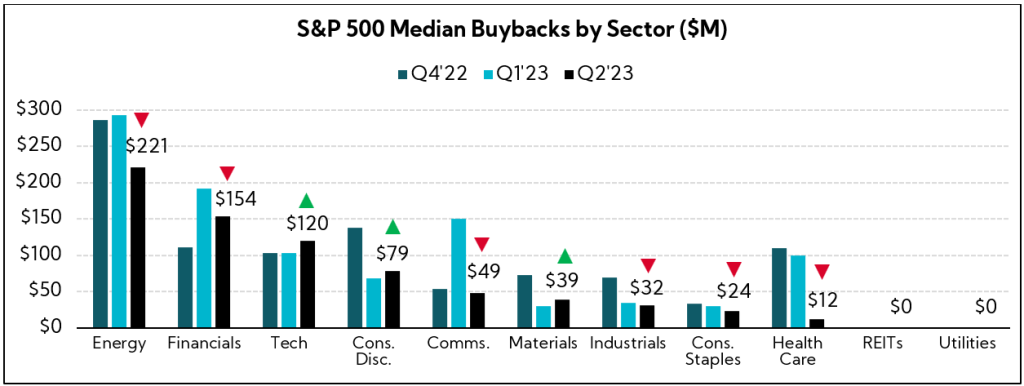
Digging a bit deeper, inside our Inside The Buy-Side® Earnings Primer® also identified buybacks as the lowest preferred use of cash by investors, with only 12% placing it as one of their top-two preferred uses of cash, and 46% recommending companies moderate or cease buyback activity. This aligns with the data above coming out of the S&P 500, as the majority of sectors experienced material decreases in share repurchases, most notably in the Energy, Communications, and Healthcare sectors.
In terms of deal activity more broadly, M&A decreased in July by 17% MoM, as incremental deal values decreased by 26%, according to FactSet. These figures represent a 33% YoY decline in deal volume but with a 20% increase YoY in aggregate M&A spending. Again, these data suggest a wait-and-see attitude by corporates that we saw in our most recent Inside The Buy-Side® Earnings Primer®.

2023 Outlook and Macro
As we continue through August, executives have provided thoughts on anticipated trends for the remainder of 2023. We have bucketed these forward-looking themes below:
- Growth: Despite continued near-term economic uncertainty, executives reinforce cautious optimism about the back half of 2023 as conditions continue to normalize in a post-pandemic world.
- Cost Control and Margins: As margin pressures continue (despite moderating input costs) and pricing power falls into question, executives point to longstanding cost saving initiatives and productivity enhancements (e.g., limited restructuring, hiring freezes, automation, and, in some cases, layoffs)
- Inflation: Continuing to moderate throughout 2023; executives warn of sticky labor costs and hesitancy to offset via additional pricing actions
- Demand / Order Trends: Within the goods economy, particularly among consumer-facing industries, wholesalers are proceeding with caution as the residual effects of the inventory glut have proven to be a harder hurdle than expected
- Consumer Trends: “Fairly strong,” but showing signs of softness; resumption of student loan payments is an anticipated headwind in the coming quarters, while purchasing behavior indicates clear preferences for services and consumables vs. durable goods
- China: A sharp contrast from last quarter, China’s rebound has been largely hindered by a sputtering economy and worsening U.S. relations, prompting some to de-risk from China in favor of safe-haven regional substitutes (e.g., India, Vietnam, and Japan)

Despite the gains seen in equity markets through July and increased hope for averting a hard economic landing, there is still a lot of uncertainty out there for both our clients and investors (we’re seeing some of that nervousness manifest itself in August’s market performance). We heard this loud and clear (and early) in our latest Inside The Buy-Side® Earnings Primer®.
With the historically volatile months of September and October in front of us, companies will be challenged to be mindful of more potential changes in the macro data while continuing to offer a reassuring narrative to investors. That said, as we often advise our clients, it’s better not to own the macro — focus on communicating what is under your control, and remain transparent about your long-term strategy, operations, and outlook.
- Reactions calculated as difference between share prices two days prior through two days post-earnings
- Source: FactSet
- As of August 17, 2023
- Geographic revenue contribution calculations determined by FactSet based on latest annual filings
- The WSJ Dollar Index is an index of the value of the U.S. dollar relative to 16 foreign currencies
- Reactions calculated as difference between share prices two days prior through two days post-earnings
- Latest vs. June ’23
- Latest vs. Sept ’22
- As of 12:00pm August 17, 2023
- The total number of companies are different across revenue and EPS charts and based on the data available and reported by companies at the time of our publication
- Dry powder refers to cash and short-term, highly liquid investments that are readily convertible to known amounts of cash