
2021 In Review
The Investor Mindset
Heading into Q3’21 earnings, a convergence of factors was creating a level of noise and intensity that was truly unprecedented and impacting everyone differently, and so many in more adverse than favorable ways. In our Inside The Buy-Side® Earnings Primer®, we provided our perspective on where the investor mindset was after an unprecedented 18 months.
In summary:
At the onset of COVID-19, organizations began processing the impact of China with a few having the foresight to incorporate COVID-related impacts into Q1 / full year 2020 guides. It wasn’t until late March / early April that the far-reaching effects of this seemingly isolated incident began wreaking havoc. Executives applied lessons learned from the Great Financial Crisis and aggressively cut costs early, building cash reserves.
And build they did. As Q2 drew near, expectations were for down 40-50% and for the harder hit, such as leisure and transportation, down 70-80% – an epic cratering. What’s our favorite adage and a hallmark of best-in-class companies? Under promise and over Deliver. And indeed they did.
Company narratives pivoted to one of positioning for strength while mitigating COVID-related impact and managing the business effectively. Q3 and Q4 saw continued signs of sequential strength and promises of a vaccine brought hope.
For the full year, executives issued relatively conservative guides given continued uncertainty with the vaccine roll-out but with a narrative of sequential improvement and signals of accelerating demand. At the same time, our Q4’20 Earnings Primer®, published in January, found nearly one-third of investors voicing concern with inflation, more than doubling QoQ, preceding the CPI registering monthly increases and a meaningful step-up in April.
This was followed by supply chain disruption concerns, first escalating due to a semiconductor shortage, exacerbated by February’s Texas freeze, port backlogs and the Suez Canal blockage in March. And remember all that cash that was reinvested two to three quarters prior?
Our Q1’21 Earnings Primer®, published in April, set record levels of bullish investor sentiment (over a 14-year period) and perceived management tone, followed by continued upbeat views on Q2’21, which saw record expectations for earnings beats and sequential improvement in EPS, organic growth, FCF, and margins, as well as 2021 U.S. GDP forecasts of 6.5% on average.
There were unprecedented levels of beats-and-raises, leading the sell side to raise estimates more meaningfully following the previous five quarters that saw S&P 500 companies exceeding consensus by 19.1% on average. Yet at the same time, investors voiced louder concern about inflation and supply chain disruption (potentially) on the horizon.
Following Q2’21 record beats, on a per- share basis, earnings consensus for Q3 increased by 2.9% during the quarter compared to the average over the past five years that saw earnings estimates falling 2.9%. This came as our Q3’21 Earnings Primer® found fewer bulls, mixed views on KPIs, and proliferating concerns.
While we had been hearing about inflation and supply chain disruption throughout the year, Q3’21 was the first quarter where investors expected to see the tangible impact.
However, 2021 revenue guidance raises remained bountiful with rising demand tides, which are expected to continue into 2022 and we saw the fourth-highest percentage of companies reporting a positive EPS surprise (81%) since 2008, driving major indices to all-time highs.
Still, Q3’21 margins began to see a pull back, with net profit margin for the S&P 500 at 12.9%, above the 5-year average of 10.9% but down from the previous quarter’s record-high of 13.1%.
Right now, there’s a lot of uncertainty going around, and the Street loathes uncertainty. And while the positive demand narrative is a strong offset to these headwinds, there remains a market psychology globally at play.
- When will the pervasive cost increases hit a wall?
- How long will it take for that to materialize and reverberate in company performances?
- Will demand wait for supply to catch up?
- Is demand inflated due to inventory build?
- What about the consumer that’s spending more on everything?
- How impactful will the China first, second and third derivative impact be?
Headwinds like these don’t evaporate. They need to work their way out. And not to mention the concerning omicron COVID-19 variant that was not reflected in sentiment last quarter.
Thought Leadership Wrapped
In 2021, we published our: Annual ESG Miniseries; our Inside The Buy-Side’s 48th Earnings Primer® and 26th Industrial Sentiment Survey® editions; four Commencing the Quarter and four Closing the Quarter; 15 Earnings Snaps; and covered key topical areas, including:
- Buybacks
- Digital Transformation
- Inflation
- IR Strategy Benchmarking
- M&A
- Multi-segment Companies/Conglomerates
- Supply Chain Disruption
- Talent
- Virtual Investor Days
Wrapping up 2021, here are our three publications with the most client reach:
Buybacks – The Next Frontier of Capital Deployment Effectiveness and Competitive Advantage Building (March 26, 2021)
For nearly 10 years, we have tracked sentiment on capital deployment uses, asking institutional investor and analyst to prioritize their preferences. The results? Six consecutive years where reinvestment and debt paydown have been the leading first and second priorities. Except for dry powder (i.e., stashing cash) increasing in March 2020, no use has seen nearly the same level of preference as reinvestment and debt paydown.
Following those two preferences, companies are left primarily with four options:
- Hoard cash
- Maintain/grow the dividend
- Repurchase shares
- Acquire
What really strikes us is that buybacks have remained among the bottom two uses for the past 6 years, and often the lowest priority, even in periods of declining share prices (e.g., late 2015).
With S&P 500 companies sitting on more than $2.7 trillion in cash at the end of 2020, 20% more than they had in 2019 (Source: S&P Global), investors were looking for companies to put their cash to work – after reinvesting for growth, of course, and addressing debt levels, if that was an issue. Regarding buybacks, last year, our proprietary research found more than one-third of S&P 500 constituents suspending buybacks by June due to the Pandemic and, by year end, companies had spent 29% less on share repurchases than in 2019 (Source: S&P Global). However, a renewed focus on share buybacks emerged in Q4 2020, which saw a 28% increase to $130.5B for the S&P 500. As an update (spend they did!), companies in the S&P 500 repurchased $235B during Q3’21, topping the previous record of $223B set in Q4’18.
Still, our Quarterly Inside The Buy-Side® Earnings Primer® continues to find that institutional investors are deprioritizing buybacks. The key questions are, “Why?” and “For what companies do we see elevated appetite for buybacks?”
To understand why, we conducted an analysis of investor commentary in our Corbin Universe database, which we bucketed into four key profiles:

Acquisitive Companies: "The Acquirers"
History of acquisitions and/or strong M&A appetite. Investor preference:
- Acquisitions
- Reinvestment
- Buybacks

Non-Acquisitive Companies: "The Steady-Eddies"
Limited M&A appetite, income-paying or defensive
- Investor preference: balance of reinvestment, buybacks, and dividends
- Companies typically have strong balance sheets; few see debt reduction

Underperformers: "The Underperformers"
Bottom 25% of companies, which saw 37% share price decreases over a 3-year period leading into the perception study:
- Investor preference: 1) buybacks; and 2) debt paydown
- Companies typically have distressed share price or undergoing a turnaround
- Significant overlap with “The Leveraged” group

Debt Ladened: "The Leveraged"
Companies with debt levels identified as a company weakness:
- Investor preference: debt paydown
- Companies primarily had debt levels >3.5x Net Debt-to-EBITDA
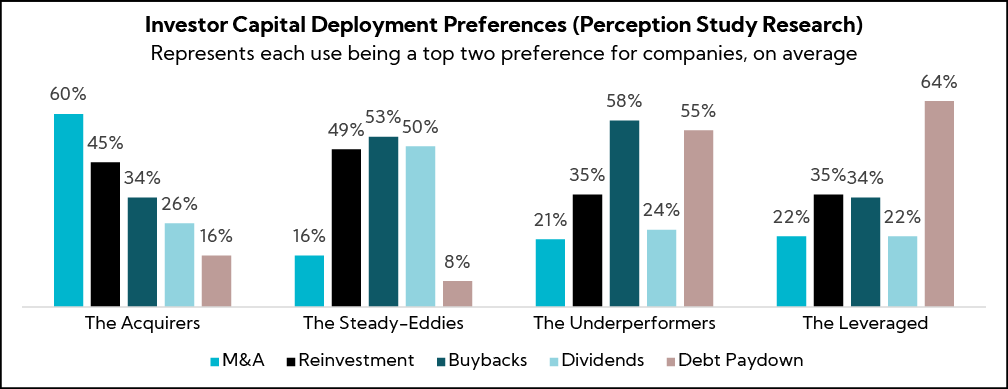
The two company profiles with elevated investor appetite for buybacks are The Underperformers and The Steady-Eddies. And, interestingly, The Acquirers and The Leveraged see similar buyback preferences, both registering at 34%. To better understand why investors consistently rate buybacks the lowest when asked to rank their preferences in general, we mined our data.
The top reason why investors do not favor buybacks broadly is because they believe management teams are not effective at timing share buybacks at appropriate prices
- For many investors, compelling M&A that advances the company’s strategy is viewed as a better use of cash but in the absence of M&A, they prefer buybacks
Investors most often favor buybacks for the following situations, which are not mutually exclusive:
- Taking advantage of short-term price dislocations
- When undergoing a transformation or turnaround strategy, as it demonstrates conviction in the long-term vision
- When there is no compelling M&A, a company is digesting a transformational acquisition, or has a poor M&A track record
- To offset dilution / options creep
- In periods of low cyclical demand when the cycle is nearing a turn
- When flush with cash
Investors express the most concern regarding buybacks when:
- Buying back shares at high prices
- Announcing a large buyback program and then not buying back shares at attractive prices
- Leveraging as an EPS growth tool too often
- There is low trading liquidity to begin with
- Management addresses “cheap” valuation with investors but does not buy back shares (note: We recommend avoiding addressing valuation, as doing so raises a red flag for investors.) Shameless plug: Our perception study provides research-based insights and strategies to address chronic undervaluation.

We have assisted many clients with tightening their buyback strategy and communication approach and a few best practices include:
- Develop a valuation model that serves as a trigger to buy back stock; closely monitor book value
- Communicate a clear share repurchase policy, including whether the policy is opportunistic, programmatic, or in place to offset options dilution
- Communicate the board-approved authorization level (dollar or share amount)
- Provide quarterly updates on share buyback activity
Multi-segment Companies/Conglomerates: Overcoming the Perception Wall and Equipping the Board with Investor Insights (December 3, 2021)
GE’s November announcement that it will form three public companies has revived a decades-long debate about the future of the conglomerate/multi-segment companies. While our proprietary research finds that 64% of investors prefer pure-plays over multi- industry businesses in general, we’ve identified notable exceptions through our ongoing Voice of Investor® Perception Study research on behalf of our clients. That is to say that while GE is ending its conglomerate approach, it doesn’t signal the end of an era for all conglomerates.
While bellwethers GE, DowDuPont and United Technologies have moved to separate their businesses in the past several years, as well as Toshiba recently announcing a strategic review, our company-specific research reveals significant investor buy-in to the multi-segment/conglomerate approach.
Following the 2008 Financial Crisis, activist investors have aggressively pushed for the separation of conglomerates or the divestment/spin-off/sale of assets on the thesis that individual businesses as part of a multi-segment conglomerate underperform pure-play peers. So far through Q3 YTD in 2021, there has been a 5.1% increase in activist investors in the U.S. publicly pushing for divestitures, as well as a 54.5% increase in those opposing mergers, relative to the same period last year. (Source: Activist Insight) The only other types of activist agendas to experience increases relative to last year are environmental, governance, and remuneration. All other types – management, M&A, capital structure, operational, shareholder returns, and social – have seen decreases year-over-year.
This is particularly true for industrials – the most common sector seeing companies taking a multi-segment approach – which has represented 15% of all activist campaigns globally through Q3 2021 (followed by consumer cyclical, financials, and technology at 13%).
Our primary Voice of Investor® research identified company profiles most commonly receiving the greatest buy-in to the multi-segment or conglomerate approach are:
- Cash cows (typically from legacy market-leading businesses) fueling investments and acquisitions in a newer, higher-growth business(es)
- Core expertise applied to a diversified mix of businesses
- Earnings compounders
- Countercyclical effects
- Vertical integration
Sum-of-the-parts, a common technique utilized by activists to evaluate the different businesses in a multi-segment company, has not been as widely utilized by traditional institutional investors. Across more than 16,000 interviews conducted over the last 14 years, fewer than 2% of investors report utilizing SOP as a primary valuation methodology. For multi-segment companies/conglomerates, this percentage remains below 10%, on average.
Across our database, the only types of companies that see more than 30% of investors (<2% of companies!) utilizing sum-of-the-parts are:
- Significantly disparate businesses with no apparent synergies
- Core businesses with a third option-like business (e.g., a financial company with two core businesses and a third strategic investments business)
- Cash cow business facing secular decline (what we call a “melting ice cube”), with a higher-growth business mature enough to now stand on its own
Indeed, mining our data unveils SOP is a part of the conversation but often utilized as a secondary approach with less weight given than traditional metrics and methodologies (i.e., P/E, DCF), particularly due to:
- Challenges in identifying peer comparables for a segment
- Little confidence by the investors’ own admission in terms of estimating the sale price
- Potential for businesses to devalue over time

Just as we noted with our thought leadership piece on buybacks in the spring, we have identified a perception wall – as we call these types of sentiment situations – around multi- segment companies/conglomerates that must be changed from a “one-size-fits-all” to an “it depends on the company” mindset. To do so, companies must increase investor confidence in the strategic rationale of the portfolio through deliberate, masterful communication, perform well across different business environments (i.e., cycle – a word I forbid our clients to use given it doesn’t screen well), and keep a consistent pulse on investor sentiment as they are more at risk of activism.
Our Voice of Investor® Perception Study research codifies sentiment toward multi- segment corporations and our industry-leading team of advisors has deep expertise partnering with companies to create shareholder value through insights-driven communication and investment positioning strategies.
Across all sectors and market caps, our research:
- Measures investor views on business segment trends and KPIs
- Proactively monitors investor sentiment through our proprietary Vulnerability Index, including calls for divestments, sales, and splits
- Positions the board and executives to make more confident decisions around portfolio management
- Has been critical in activist defense strategies
ESG Miniseries - Beyond Checking the Box: An Authentic and Strategic Approach to Incorporating ESG into Your Culture (June 30, 2021)
At the culmination of our 4-part ESG miniseries, we hosted a webinar with Patrick Decker, CEO of Xylem and Katherine Collins, Head of Sustainable Investing at Putnam Investments, which highlighted our proprietary research from our global investor and corporate surveys, which addressed:
- Overview of the ESG Landscape, specifically notable events and key developments over the past year that have shaped the landscape as it exists today
- Primary Research on ESG: buy side perspectives and trends
- Corporate Perspectives and ESG Communication Practices
- Best practices and recommended strategies for effectively communicating ESG journeys
Throughout the series, we shared our research from a wide range of investor and corporate voices confirming that ESG has only accelerated as a key focus of their work. Challenge and uncertainty have driven a deeper public desire for all entities of power, including corporations, to act in ways that respect the needs of the world around them.
The reality is that if one deconstructs “ESG” into its most basic principles, poll after poll shows that the public – in the U.S. and across the globe – supports issues such as environmentally- friendly product design, fair treatment of workers, and responsible governance behavior from businesses. Consumers want to support and work for businesses that act ethically and are good members of the communities they operate in. However, there is also a well- documented “intention-action gap” between what people say in polls and what they actually do in their behavior or spending. Working to seize the business opportunity of closing that gap to delight customers, attract great employees, and avoid political/regulatory intrusions should be a significant driver of ESG actions.
The world’s largest companies have the resources and an urgency driven by intense scrutiny of their actions to lead the way on ESG innovation. The most forward-thinking of these global business leaders understands that a comprehensive stakeholder management strategy, inclusive of ESG, well-integrated into a broader business strategy, does not represent a “trade-off” with goals of profitability or franchise value. It’s just smart business.
Investor interest in ESG has been pivotal to its increased importance, particularly the emphasis over the last five years, but today the conversations about why ESG matters (and to whom) have expanded well beyond the investor audience to include consideration of all key stakeholders, both internal and external. It is through this wider lens that companies are assessing their ESG efforts.
As we continue to counsel clients on this ever-changing, increasingly important topic, we are continuously identifying and developing best practice. With all the ‘ESG noise’ out there, we strive to cut through the fluff and deliver relevant and actionable advice that is different and additive to what you are getting from other sources.
Despite frequently reported industry discussions on a unified set of ESG reporting standards (and, in fairness, some real progress from groups like SASB), we suspect that the ESG reporting regime, particularly for global companies, will remain complex.
That said, we suggest that corporate ESG leaders embrace its necessity and use the process as a checklist for intentional cost-benefit decisions. A checklist is outcome oriented and helps to organize your everyday efforts around a larger purpose; that is, following the necessary steps to achieve the desired outcome. Ensuring alignment with various standard setters and framework developers is a good opportunity to methodically and successfully move through the process of data disclosure. For example, do we currently collect the necessary data – based on the SASB Sustainable Industry Classification System (SICs) – to be able to align with SASB?
Too often, ESG communications and disclosure are approached as a necessary risk management and compliance function and communicated accordingly. The result is something that feels tagged on and does little to address stakeholder concerns and opportunities outside of disclosure scorekeeping. An ESG strategy that flows naturally from and is integrated with a company’s overall mission and business objectives is a far more powerful leadership tool.
The most compelling and authentic ESG roadmap is one that is both ambitious and realistic while also being inextricably linked to the larger business strategy. And, the sometimes-arduous details of disclosure carry far more weight when framed in a broader corporate purpose.
When companies begin to place sustainability as a core pillar of their business strategy, it becomes natural to think about how their own governance structures keep track of their progress. While some ESG leaders have created standalone sustainability committees within their Boards, our research suggests that this is still a progressive approach, especially for smaller and mid-cap companies. However, even in the absence of standalone sustainability committees, it is worth having a clear process for how non-dedicated Board committees and other oversight structures incorporate ESG into their work.
Examples include questioning whether an audit committee oversees ESG disclosures as well as financial statements and whether a compensation committee considers ESG metrics as an input to performance measurement for executive compensation. If ESG is truly a corporate priority, savvy observers will expect that there are well-informed oversight professionals keeping score and utilizing both carrot- and stick-based outcomes.
Communicating progress on an iterative process, such as ESG, is a journey with no finite finish line. Part of crafting an effective strategy is naturally setting a sustainable path that is not unnecessarily disruptive to the business. With that in mind, we would emphasize that it is completely acceptable (even expected) for corporate sustainability leaders to admit areas where there is room for improvement. In addition, as part of goal setting, it is good practice to set ambitious long-term goals as well as shorter-term interim goals and measure progress along the way.
Future aspirational goals are more powerful and believable when they are accompanied by interval milestones or what we like to call “breadcrumbs”. Providing updates supported by clear execution proof points along the journey to 2030 or 2050 or any period five years from now, including verification by credible 3rd party sources where possible, is best practice.
As corporate ESG efforts mature, ideally, the associated disclosure also matures. For example, as companies consider adding Scope 3 GHG emissions disclosure – and goals related to reduction – they are engaging various stakeholders up and down the value chain to understand the holistic picture of emissions.
This is important as it is estimated that ~75% of GHG emissions associated with many industry sectors derive from a company’s supply chain (i.e., Scope 3). Thus, as part of an authentic commitment to sustainability (and combating climate change), it is critical that companies incorporate Scope 3 data and associated reduction goals into their Environmental strategy.
In Closing
It’s hard to believe we’re about to close another chapter – 2021. It has been an intense but highly fulfilling year working with our valued clients to achieve great outcomes. For Corbin, this was our most successful year yet and we have much to be thankful for, most specifically, you, our advocates and supporters.
Wishing you and your family a very Happy Holiday Season and Cheery 2022!