
Early Read from Q3’23 Inside The Buy-Side® Earnings Primer®
We have now entered earnings mode and this quarter is shaping up to be a dynamic one, coming off a largely beat-and-raise Q2. We are seeing more pronounced slowing across sectors, while mixed economic data continues to muddy the waters.
This week’s Thought Leadership, which features an early read from the 56th issue of our Inside The Buy-Side® Earnings Primer®, which we will publish next Thursday.
In today’s thought leadership, we cover:
- Key Events this week
- Quick Recap Q2’23
- Early Read from Q3’23 Inside The Buy-Side® Earnings Primer®
Key Events
Employment
- Employers added 336,000 jobs in September, the strongest gain since January and up sharply from the prior month’s upwardly revised 227,000 gain. The unemployment rate held steady at 3.8% last month. Accelerating job growth has signaled an economic rebound in recent months, after the labor market slowed in the first half of the year. (Source: Labor Department)
- Initial jobless claims ticked up slightly to 207,000 in the week ending Sept. 30. Continuing claims, a proxy for the number of people receiving unemployment benefits, were also little changed at 1.7 million in the week through Sept. 23. The four-week moving average of initial claims edged down to 208,750, the lowest since February. (Source: Labor Department)
- ADP reported that private job growth totaled just 89,000 for the month, down from an upwardly revised 180,000 in August and below the 160,000 estimate from Dow Jones. ADP also said annual wage growth slowed to 5.9%, the 12th consecutive monthly decline. (Source: CNBC)
Yield Curve
- The yields on the 10-year Treasury note rose 0.119 percentage points Tuesday to 4.801%, the highest level since the subprime mortgage crisis began in August 2007. (Source: WSJ)
Housing
- The average 30-year fixed mortgage rate hit 7.49% this week, a fresh 23-year high and up from 7.31% last week. Typical mortgage rates now range 0.4% above or below that average rate, more than double the range during the years before the Fed started raising rates. (Source: Freddie Mac)
U.S.-China Relations
- The Biden administration warned Beijing of its plans to update rules that curb shipments of AI chips and chipmaking tools to China as soon as early October, a U.S. official said. The update seeks to limit access to more chipmaking tools in line with new Dutch and Japanese rules and to close some loopholes in export restrictions on AI chips. (Source: Reuters)
Europe
- European leaders said Thursday that the 27-nation bloc would not be able to fully replace U.S. support for war-torn Ukraine but made clear they were “absolutely convinced” Kyiv’s biggest financial and military backer would soon come to an agreement to provide further assistance. This comes after President Biden conceded Wednesday that he feared recent congressional chaos could disrupt U.S. aid to Ukraine. (Source: CNBC)
Quick Recap — Q2’23 Earnings Primer®
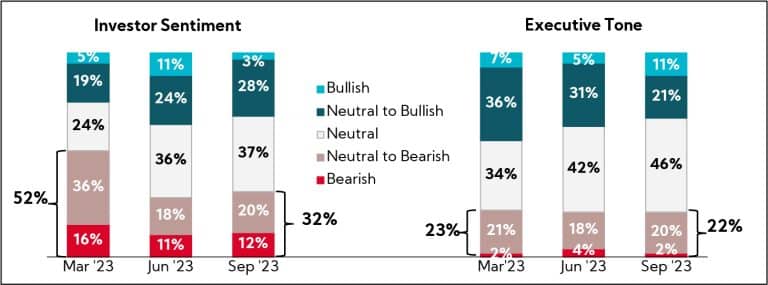
- Bearish investor sentiment receded while management tone was perceived as less optimistic overall, resulting in a more neutral outlook collectively.
- Recession clouds remained, but an increasing proportion of investors anticipated landfall in 2024.
- Capital deployment preferences overwhelmingly favored debt paydown with continued net debt-to-EBITDA thresholds of sub-2.0x, though reinvestment continued to garner increasing support QoQ.
Earnings beats held less weight through Q2 prints as lowball sell-side estimates were treated as the base case and seemingly priced in
- Despite 79% of the S&P 500 reporting positive EPS surprises, above both the 1-year (73%) and 5-year averages (77%), stock price reactions for those surpassing analyst estimates were negative, on average.
- Although the average earnings surprise factor for Q2 clocked in at +7.8% above consensus — below the 5-year average (+8.4%) but above the 10-year average +(6.4%) — positive surprises were met with an average share price depreciation of -0.5%.
- Notably, this was the largest average negative price reaction to positive EPS surprises reported by S&P 500 companies since Q2 2011 (-2.1%).
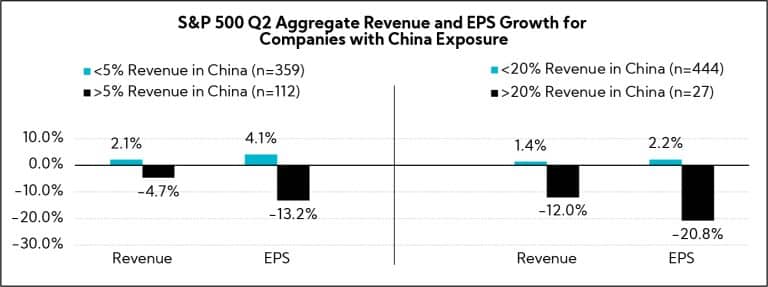
Companies with greater international exposure produced sub-par results when compared to their domestically focused counterparts. In particular, those with greater China exposure fundamentally underperformed the rest of the S&P 500, with price reactions also indicating poorer performances.
- When splitting the S&P 500 universe into:
- Companies with greater than 50% of their revenues originating in the U.S.; and
- The remainder, which have more international than U.S. exposure, the first bucket of domestically focused companies fared better on both their top- and bottom-line Q2 prints
- When digging a layer deeper, our findings reveal that greater China exposure more negatively impacted Q2 growth rates on the top and bottom line, and indexed share price performances through the first half of August revealed a negative 6% gap for those with >20% of revenues originating in China.
Based on an analysis of a basket of 987 companies across size and sector, the majority opted to raise annual sales and earnings guidance
- Revenue: 46% raised, 32% maintained, 22% lowered; 81% of full-year 2023 revenue growth guidance midpoints were above 2022 actuals
- EPS: 47% raised, 30% maintained, and 23% lowered; 61% of full-year 2023 EPS growth guide midpoints were above 2022 actuals
Full-year 2023 consensus changes for S&P 500 companies one week prior through one week post Q2 earnings find:
- Higher top-line expectations for 38% of companies
- Upwardly revised EPS expectations for 50% of companies
- Notably, for both metrics, roughly 30% of company consensus estimates were trimmed
Regarding one of our favorite topics, capital deployment:
- Capex / reinvestment remained the largest use across all sectors in the S&P 500, on average increasing 4% QoQ, but following a 15% sequential decline in Q1.
- On a sequential and annual basis, companies de-emphasized stock buybacks, down -21% QoQ and -27% YoY.
- From an M&A perspective, Q2 U.S. deal volumes decreased 8% QoQ and 22% YoY.
- Interestingly, corporate debt, on average, remained virtually unchanged QoQ.
Early Read — Q3’23 Earnings Primer®
Investor and Executive Sentiment Trend Mixed but With Slightly More Pull to More Cautious; Q3 Expectations Reflect Split Views
- 32% self-describe as Neutral to Bearish or Bearish, up from 29% in Q2, while slightly more, 37%, report current sentiment as Neutral, relatively unchanged QoQ; notably, the level of outright Bulls decreased from 11% to 3%.
- The optimistic executive tone first heard in Q1 has tempered, with 46% of investors characterizing positioning as Neutral, up from 42% in Q2 and just 34% in Q1.
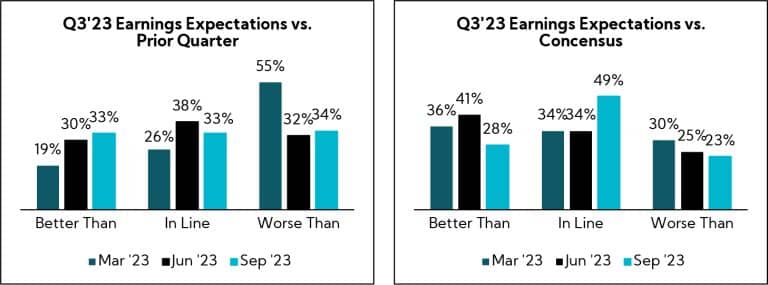
- Investor expectations for sequential performances are evenly distributed.
- After broad-based analyst hikes following better-than-expected Q2 prints and annual guidance raises, more survey participants are expecting in-line with consensus results; of note, fewer than one-quarter expect negative surprises.
- Notably, fewer expect a U.S. recession now — 66% versus 80% last quarter; 37% anticipate landfall in 2024, up from 29%.
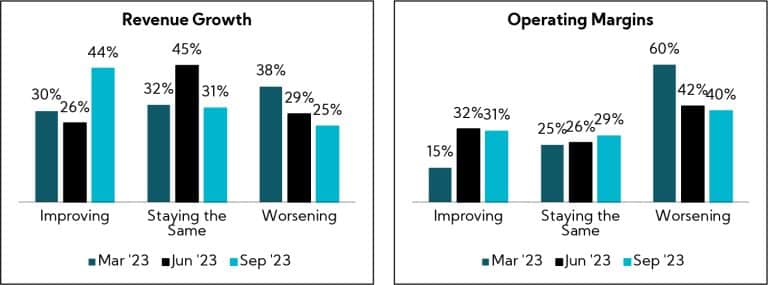
Q3’23 Expectations on KPIs See Divergent Views
- More, 44%, now anticipate sequentially Improving revenue growth (companies continue to eat through backlogs), with just one-quarter modeling Worsening performances.
- Views on operating margin performance largely mirrors last quarter’s expectations with more expecting continued pressure.
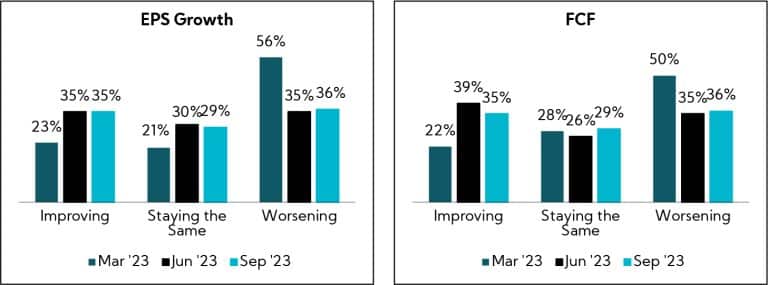
- EPS and FCF register parallel views, with nearly equal numbers in the Improving and Worsening camps.
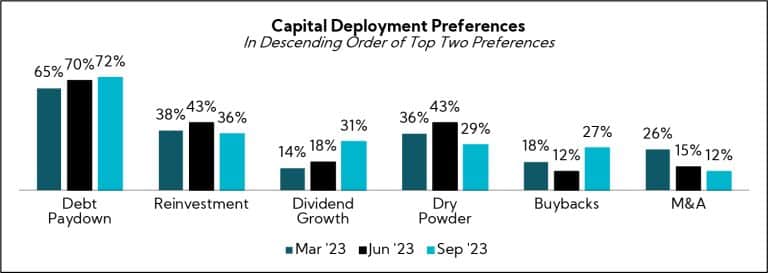
Preference for Debt Paydown Sets New Survey Record as Investors Continue to Prioritize Conservative Balance Sheets; Support for Reinvestment, While Still #2, Ebbs QoQ
- Debt paydown remains the preferred use of cash by nearly three-quarters of investors, followed by reinvestment, albeit at slightly lower support QoQ.
- Despite tempered U.S. recessionary concerns, 7 in 10 investment professionals continue to favor a net debt-to-EBITDA level of 2.0x or lower.
- Notably, dividends see increased support as investors look for companies to compete with alternative investment vehicles.
- Amid market volatility and pressure, buybacks see a boost in support, increasing 15 pts to 27% after broad-based company reductions in Q2.
- M&A downshifts to last, representing the lowest level of support in a decade.
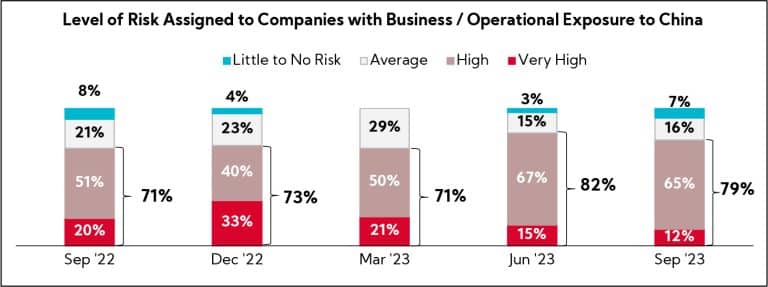
Perhaps the Most Notable Area of Alignment, Concerns Over China Reach Highest Recorded Levels as the Geopolitical Frontier Dominates Investor Mindshare
- More than 70% point to Geopolitics as the leading concern this quarter, nearly doubling from 37% last quarter, with 50% directly citing caution toward China throughout unaided responses.
- Following a disappointing PRC reopening in Q1 and further economic distress signals, fewer than 20% expect the Chinese economy to Improve over the next six months, and those expecting the economy to Worsen increases to 65% from 42% QoQ.
- 79% continue to assign a Very High or High level of risk to companies with operational or business exposure to China, above the 1-year average of 74%.

Our survey this quarter finds investors and executives alike continuing to shift into neutral as views and expectations reflect increased opaqueness. In general, results show an increasing lack of conviction in market sentiment, with the noted exception of geopolitical concerns spiking QoQ.
That said, focus remains on conservative balance sheets and margins, with 71% prioritizing bottom over top lines. With less than three months to go to close out this year, analyst and investor questions will jump to 2024 and those eager attempts should be swatted and redirected…in a non-harming way, or course, as Buddhist principle advises. Afterall, we are all part of the same ecosystem and balance creates harmony.
Next week, we’ll be publishing our latest research-based insights and more as we “Commence the Quarter.”