
Closing the Quarter – Q3'23
In today’s thought leadership, we cover:
- Key Events this week
- With Q3’23 earnings season in the books, our Closing the Quarter Summary reflects notable themes: Earnings, Guidance, Capital Allocation, and Outlook
Key Events
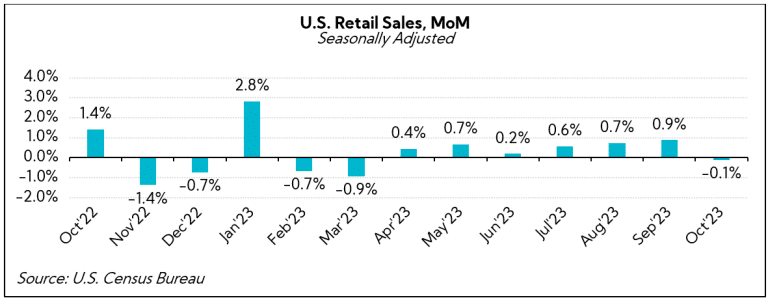
Retail Sales
- U.S. retail sales fell 0.1% in October from a month earlier, representing the first decline since March. Contributing to the declines were reduced spending at stores, car dealerships, and gas stations. (Source: U.S. Census Bureau)
Inflation
- The U.S. Consumer Price Index was flat in October from the previous month, but increased 3.2% from a year ago, both below consensus estimates of +0.1% and +3.3%, respectively. Core CPI, which excludes volatile food and energy prices, was up 4.0% YoY versus expectations for a 4.1% rise. (Source: U.S. Labor Department)
- The U.S. Producer Price Index for final demand fell 0.5% in October, the most considerable decrease since April 2020 and contrasting with a 0.4% rise in the prior month. The decline was mainly in final demand goods (such as gasoline and furniture), which fell by 1.4%, whereas service prices (such as transportation and warehousing costs) remained steady. (Source: U.S. Labor Department)
U.S. Government
- Senate leaders voted Wednesday in favor of the short-term government funding bill the House passed Tuesday ahead of Friday’s shutdown deadline. House Speaker Mike Johnson pitched a two-step plan that he described as a “laddered continuing resolution” that will keep the government funded at 2023 levels. The bill extends most government funding until February 2, 2024. (Source: ABC News)
U.S. / China Relations
- President Biden and Xi Jinping managed to insert a warmer tone in the contentious U.S. / China relationship at their summit Wednesday. Biden and Xi agreed to resume communications between their militaries, cooperate on choking off fentanyl production, and begin a dialogue on the risks of AI. In a rare press conference appearance by the President following the talks, Biden, when responding to a separate question of whether he sees Xi as a dictator, said, “Well look, he is.” (Source: WSJ)
Closing the Quarter Summary
Heading into Q3 earnings, our Q3’23 Inside The Buy-Side® Earnings Primer® found more neutral and slightly less optimistic investor views and perceived management tone QoQ. Sequential performance expectations were divided following a largely beat-and-raise Q2’23, but with mounting geopolitical concerns and persistent fears of slowing growth, ultimately representing a growing lack of conviction on market direction amidst increased macro risks.
With Q3’23 earnings season in the books, we “Close the Quarter” with some notable themes:
1. Earnings
Stronger-than-expected Q3 EPS prints result in consensus raises through the end of the year, while roughly one-third cut revenue expectations.
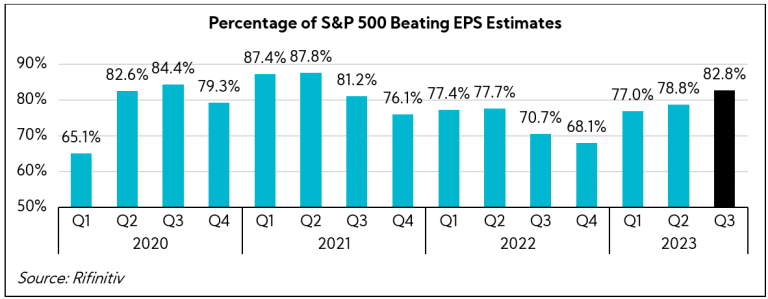
With 93% of the S&P 500 reporting earnings to date, an impressive 82.8% have reported EPS above analyst expectations, surpassing both the 1-year average of 74% and 5-year average of 77%. Interestingly, this quarter’s earnings beat rate represents the highest percentage of companies beating consensus estimates since the second quarter of 2021, with an average surprise factor of +7.1%.
At face value, the S&P 500 Q3 performance1 culminated in a +6.3% aggregate earnings growth rate YoY, a substantial improvement from the +1.4% growth anticipated heading into the quarter2 and a clear reflection of executives prioritizing the bottom line.
But important to note before getting too excited, Q3 YoY earnings comps were easier (vs. -3.3% in Q3’22 when excluding the high-performing Energy sector). Moreover, given the market cap-weighted nature of the S&P 500, the so-called “Magnificent Seven” — comprising Alphabet, Amazon, Apple, Meta, Microsoft, Nvidia, and Tesla whose market caps represent ~28% of the S&P 500’s $37.7 trillion — particularly skewed this quarter’s aggregate performance. Without the contributions of these seven companies, aggregate earnings would have been just +0.2%.
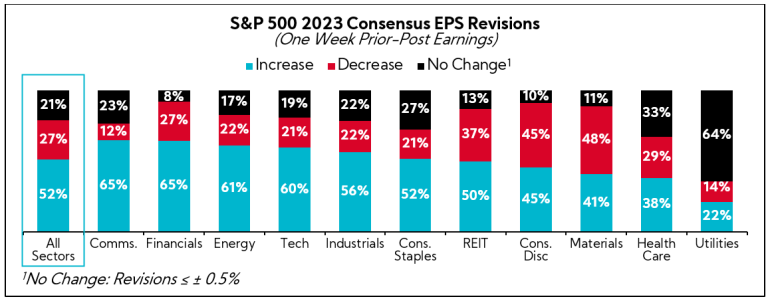
Still, over half of S&P 500 constituents, 52%, saw EPS expectations increased for 2023, with a majority of companies in every sector experiencing upward revisions except for Materials, Consumer Discretionary, and REITs.
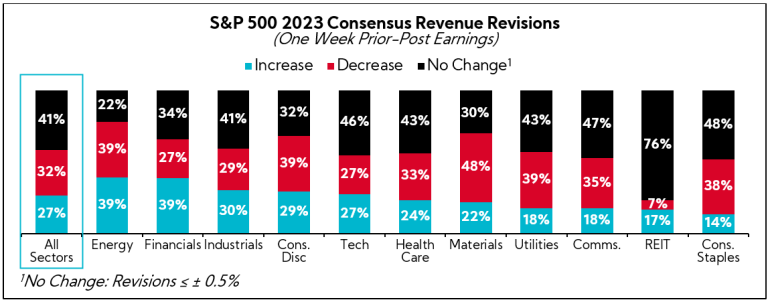
Conversely, 41% saw their 2023 top-line estimates maintained and 32% lowered. This comes amidst a small Q3 aggregate revenue performance of +1.4% YoY. Leading the revenue consensus decreases are Materials, Consumer Discretionary, and Energy sectors.
2. Guidance
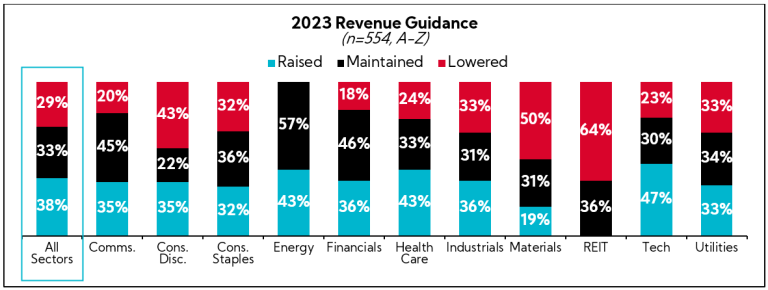
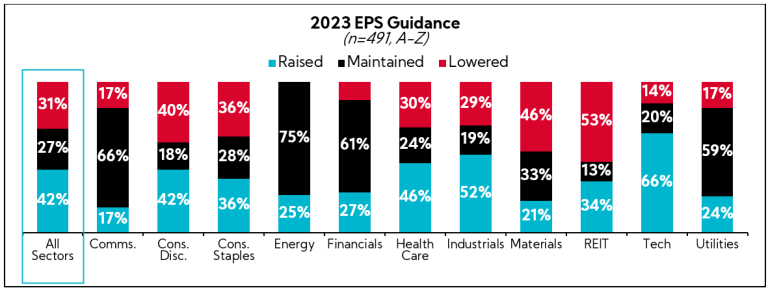
More companies across the broader U.S. universe are raising annual EPS guidance than they are revenue for 2023, though both metrics saw the majority of companies increasing. Still, roughly 30% decreased top- and/or bottom-line guides through Q3.
As we do every quarter, we analyzed annual revenue and EPS guidance trends for a basket of 752 calendar year-end U.S. companies with market caps greater than $500M that have reported to date.3 Below are our findings4:
- Most companies raised both revenue and EPS guidance this quarter, 38% and 42%, respectively
- Revenue: Tech (47%), Energy (43%), and Healthcare (43%) drove the largest positive revenue revisions this quarter, while REITs (64%), Materials (50%), and Consumer Discretionary (43%) the greatest decreases
- EPS: Tech (66%), Industrials (52%), and Healthcare (46%) led EPS guidance raises, while REITs (53%), Materials (46%), and Consumer Discretionary (40%) again were responsible for the most downward revisions
- 80% of full-year 2023 revenue growth guidance midpoints are above 2022 actuals, largely in line with 81% last quarter
- 57% of full-year 2023 EPS growth guidance midpoints are above 2022 actuals, below 61% last quarter
3. Capital Allocation
To garner insights into capital spending trends, we analyzed the average sector cash allocations within the S&P 500:
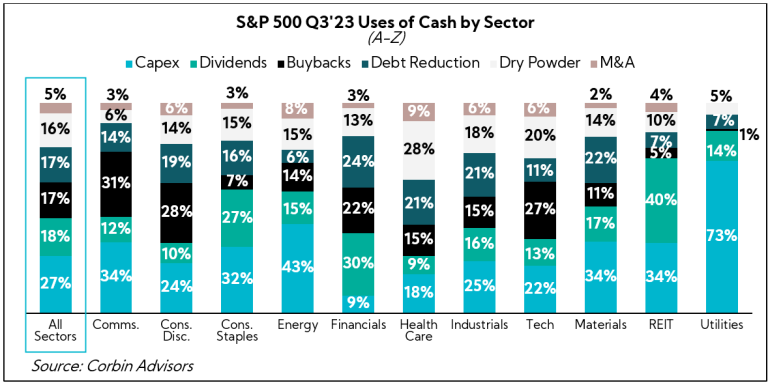
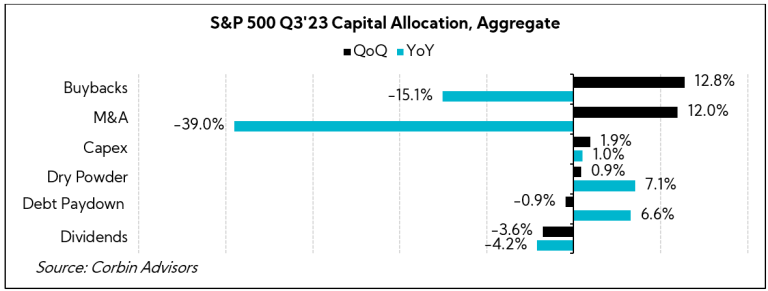
Last quarter, both buybacks and M&A saw QoQ and YoY declines of at least 20% across the S&P 500. However, when analyzing the cash uses of the index through Q3, trends have reversed with buybacks and M&A increasing roughly 12% sequentially. That said, figures remain relatively dismal versus 2022 comps, with buybacks and M&A seeing 15% and 39% declines YoY, respectively.
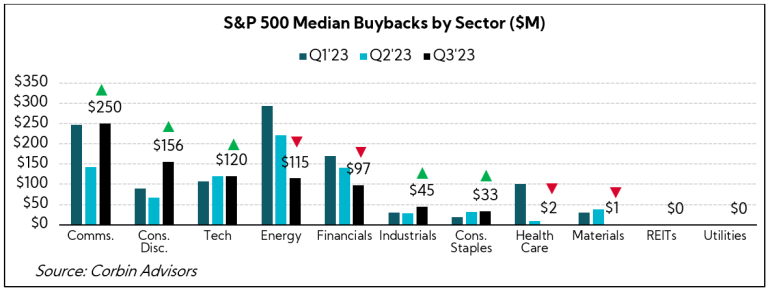
Digging a bit deeper, our Q3’23 Inside The Buy-Side® Earnings Primer® identified renewed interest in buybacks as a preferred use of cash by investors heading into the quarter, with 27% placing it as one of their top two preferred uses of cash versus only 12% in the prior quarter. Reflecting this sentiment, the majority of sectors saw material increases in median share repurchase activity, particularly in the Communications and Consumer Discretionary sectors.
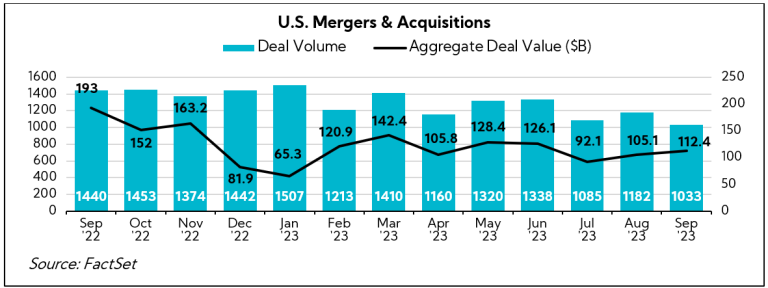
In terms of deal activity more broadly, aggregate M&A deal values increased in September by 7% sequentially despite deal volumes decreasing by 13% in the same period. These figures represent a 28% decline in deal volume and 42% decrease in aggregate M&A spending YoY. The Big So What™? While the overall M&A environment in the U.S. remains relatively stagnant, the deals getting done are of the larger variety.
4. Outlook
Despite continued consensus beats, which can give an illusion of strength, outlooks are mixed, at best, and executive commentary is increasingly cautious amidst pervasive uncertainty and a varied slate of economic indicators.
We’ve organized executive insights regarding anticipated trends for the remainder of 2023 and into 2024. These have been bucketed into the themes below:
- Geopolitics: Executives continue to express caution as the latest injection of geopolitical uncertainty further weighs on sentiment; “there are reasons to remain vigilant”
- Growth: Reduced discretionary spending is amplified by reluctance to restock inventory, with executives warning of mixed signals through the beginning of Q4
- Margins: Despite lower demand and signs of downward pricing pressure, companies largely hold firm on margin rates, helped by pockets of deflation
- Consumer Health: Consumers pull the purse strings tighter; executives point to leaner spending habits and trade-down activity, particularly among lower income shoppers, as the compounding effects of inflation, debt, and student loan payments weigh on sentiment
- China: Companies report mixed performances and ongoing geopolitical tensions as factors marring results; even companies with longstanding ties to the country continue to redirect new investment towards alternative regional substitutes
- Europe: Executives see some encouraging signs and cite stable demand (albeit, more moderate than the U.S.); inflation and geopolitical uncertainty remain significant headwinds
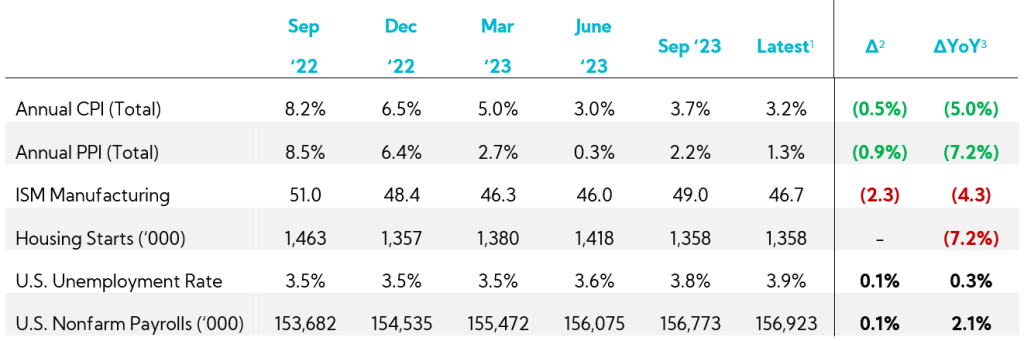
As we continue through November, key economic indicators shed light on some of the factors underpinning the macro environment. While the Consumer Price Index (CPI) and Purchaser Price Index (PPI) show a decrease in overall inflation levels, the ISM manufacturing index suggests a slowdown in industrial activity, and housing starts have decreased by 7.2% YoY. The labor market continues to be resilient, as evidenced by continued nonfarm payroll growth, though unemployment levels have ticked up slightly.
Key Economic Indicators

We hope you found our Closing the Quarter installment interesting and insightful as we put a bow on this earnings season with some key themes around broad-based company strategy and positioning. It’s been an interesting year with the majority of the S&P 500 handily beating consensus estimates each quarter, but with top-line trends reinforcing slowing growth and bottom-line performances demonstrating leadership focus on controlling what they can, with a big emphasis in managing expenses.
As 2024 comes in focus, we will see another batch of conservative annual outlooks, which will serve to calibrate expectations and further support the decoupling of the macro from the markets. Next year will be dynamics for many reasons, but mainly because we have a U.S. Presidential Election, which is sure to influence sentiment and spending behavior.
- As of 11/10/23
- Aggregate analyst estimates as of 9/30/23
- As of November 15, 2023
- The total number of companies are different across revenue and EPS charts and based on the data available and reported by companies at the time of our publication